
Table of Contents
Over the past two decades, trend following has been a successful trading strategy used by many fund managers, professional traders, and global macro hedge funds to profit in global futures markets. Applying trend-following strategies to stocks has recently gained significant attention, with a surge in published research and articles. Increasingly, the literature suggests that the trend effects observed in futures markets can similarly apply to stock markets.
Michael W. Covel, the founder of the renowned trend-following company TrendFollowing.com, presents a unique perspective. He states, “In capital markets, investors often seek to establish ‘causal relationships’ in price movements, believing it provides a sense of security to their strategies. However, trend following takes a different path. It doesn’t attempt to predict market directions, but instead, it places a strong emphasis on discipline, precise trading rules, and strict risk control to navigate market volatility.”
Additionally, Cole Wilcox and Eric Crittenden (2005) outlined the conditions for implementing a trend-following strategy in the U.S. stock market:
Based on these principles, this article designs a trend-following strategy suitable for investors’ reference in the Taiwanese stock market.
Note: To increase entry opportunities, the entry condition of “highest closing price in history” is modified to “highest closing price in the past year.” Readers may adjust this condition as they see fit.
This article uses macOS and Jupyter Notebook as the editor.
import os
import tejapi
import pandas as pd
import numpy as np
import matplotlib.pyplot as plt

tej_key = 'your key'
api_base = 'https://api.tej.com.tw'
os.environ['TEJAPI_KEY'] = tej_key
os.environ['TEJAPI_BASE'] = api_base
start = '2019-04-01'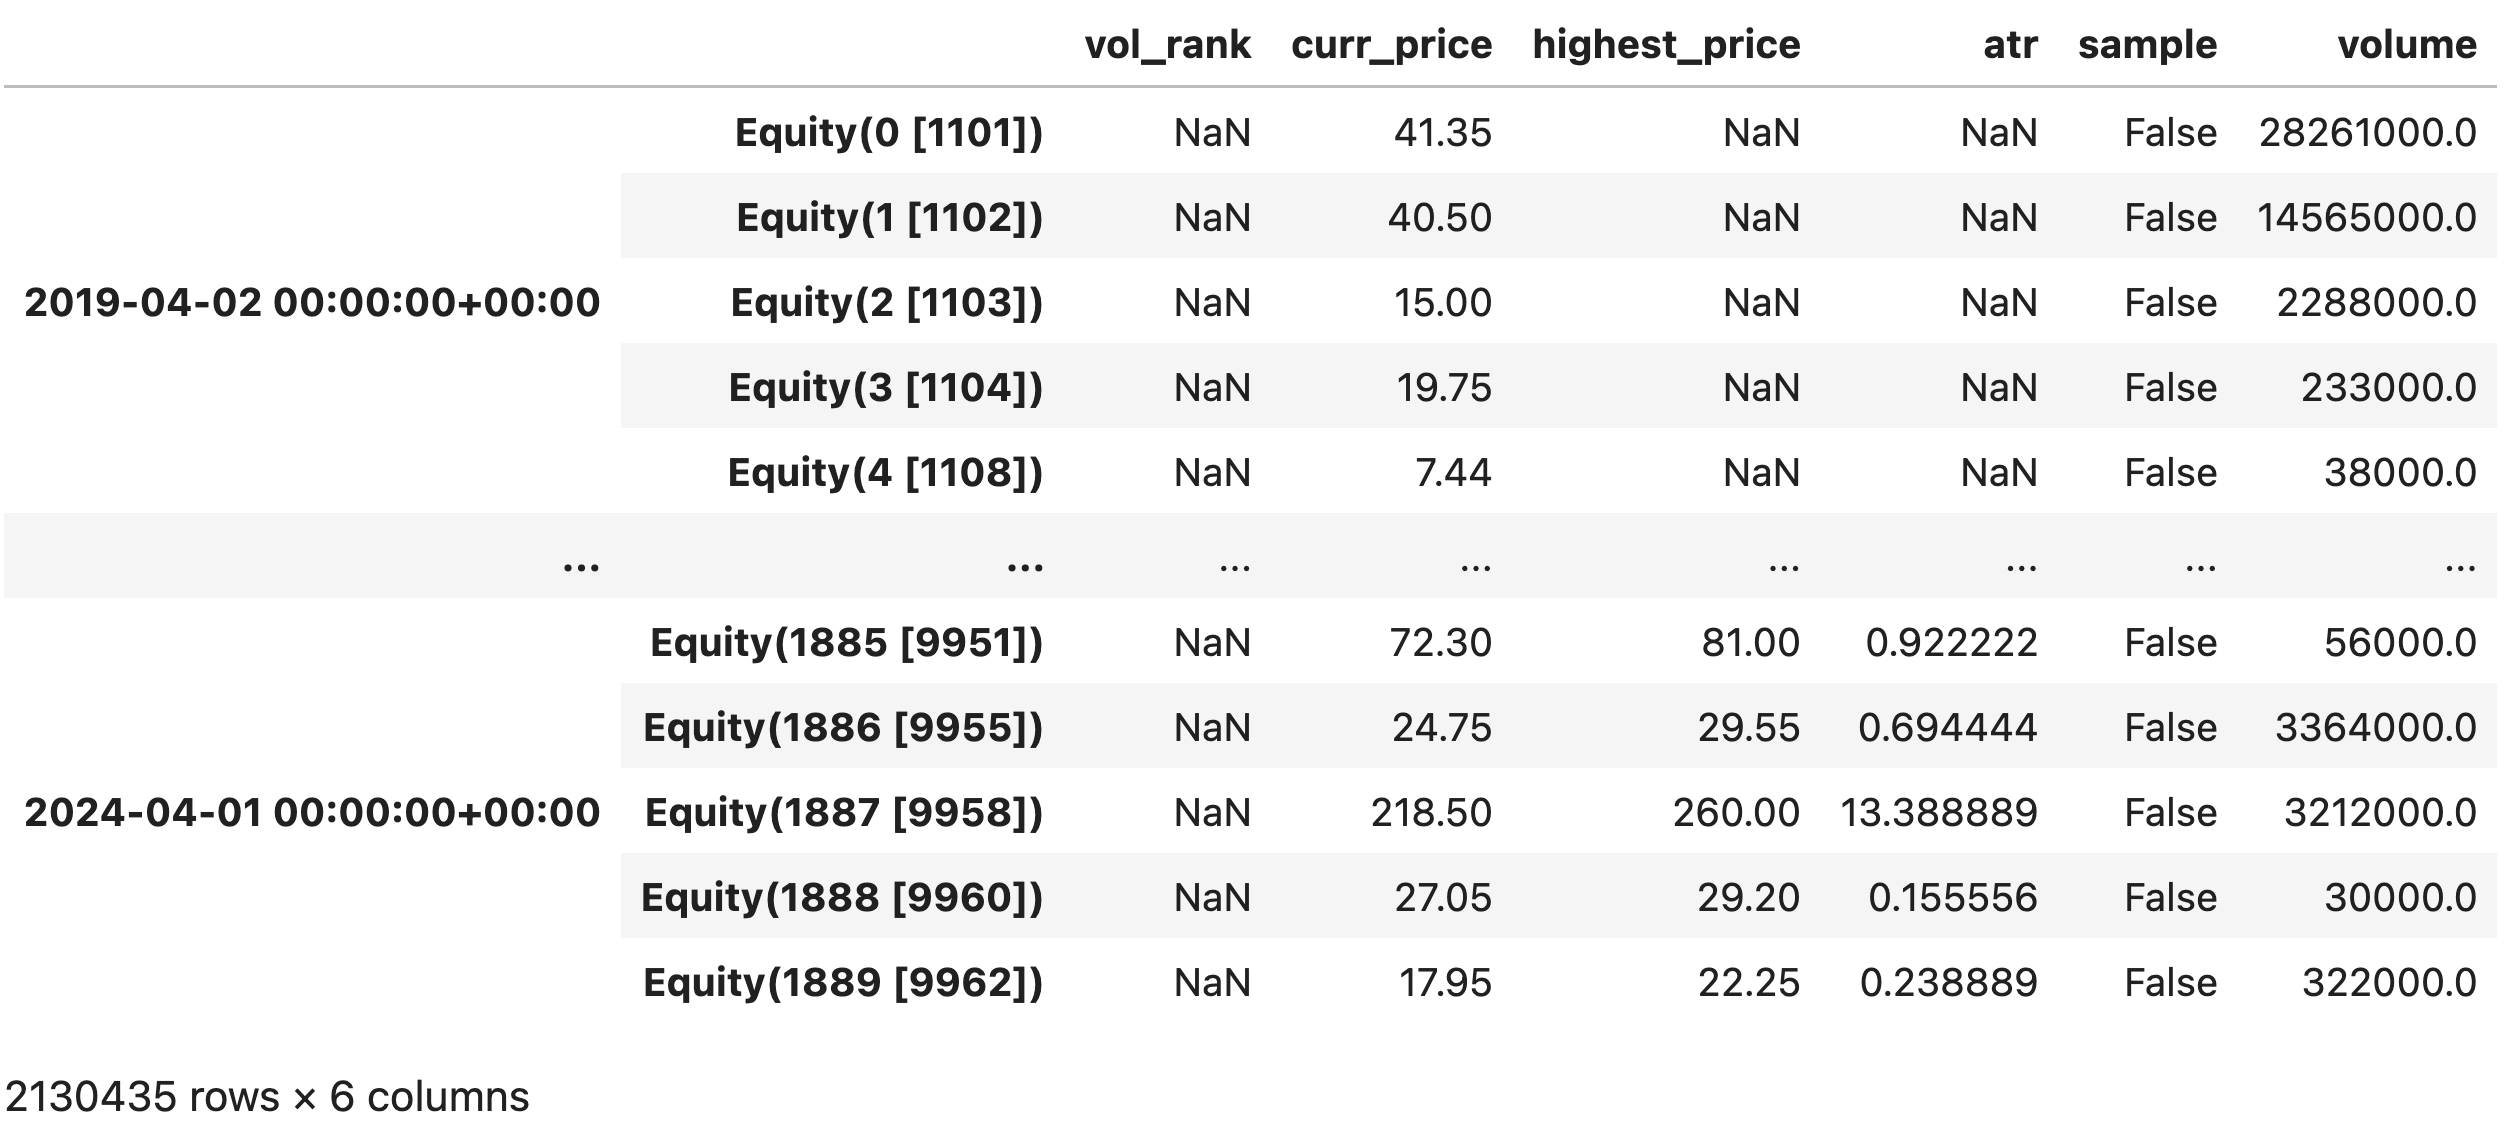
end = '2024-04-01'get_universe function to obtain the stock pool.The data spans from April 1, 2019, to April 1, 2024. We filter all common stocks listed on the Taiwanese stock market as the stock pool and include the Taiwan Weighted Index (IR0001) for market comparison. Finally, we ingest the bundle.
Note: To access all common stocks listed on the market, data for 1,890 stocks needs to be retrieved. The large volume of data may result in local memory insufficiency or significant API key usage. Please use it with caution.
The CustomFactor allows users to design customized factors as needed. In this case study, we use it to handle:
Pipeline() provides users with the capability to quickly process quantitative indicators and price-volume data for multiple stocks. In this case study, we use it to handle:
Initialize FunctionThe initialize() function is used to define the daily trading environment before trading starts. In this example, we set:
context.stop_loss variable to record stop-loss points during backtestinghandle_data FunctionThe handle_data() function is a crucial part of constructing the strategy. It is called daily after the backtest starts and is primarily responsible for setting the trading strategy, placing orders, and recording trading information.
For detailed trading rules for this strategy, please refer to trend_following.ipynb.
Use run_algorithm() to execute the above-set strategy, setting the trading period from start_dt (2019-04-16) to end_dt (2024-04-01), using the tquant dataset, with an initial capital of one million NT dollars. The output results includes the daily performance and transaction details.
Start Building Portfolios That Outperform the Market!
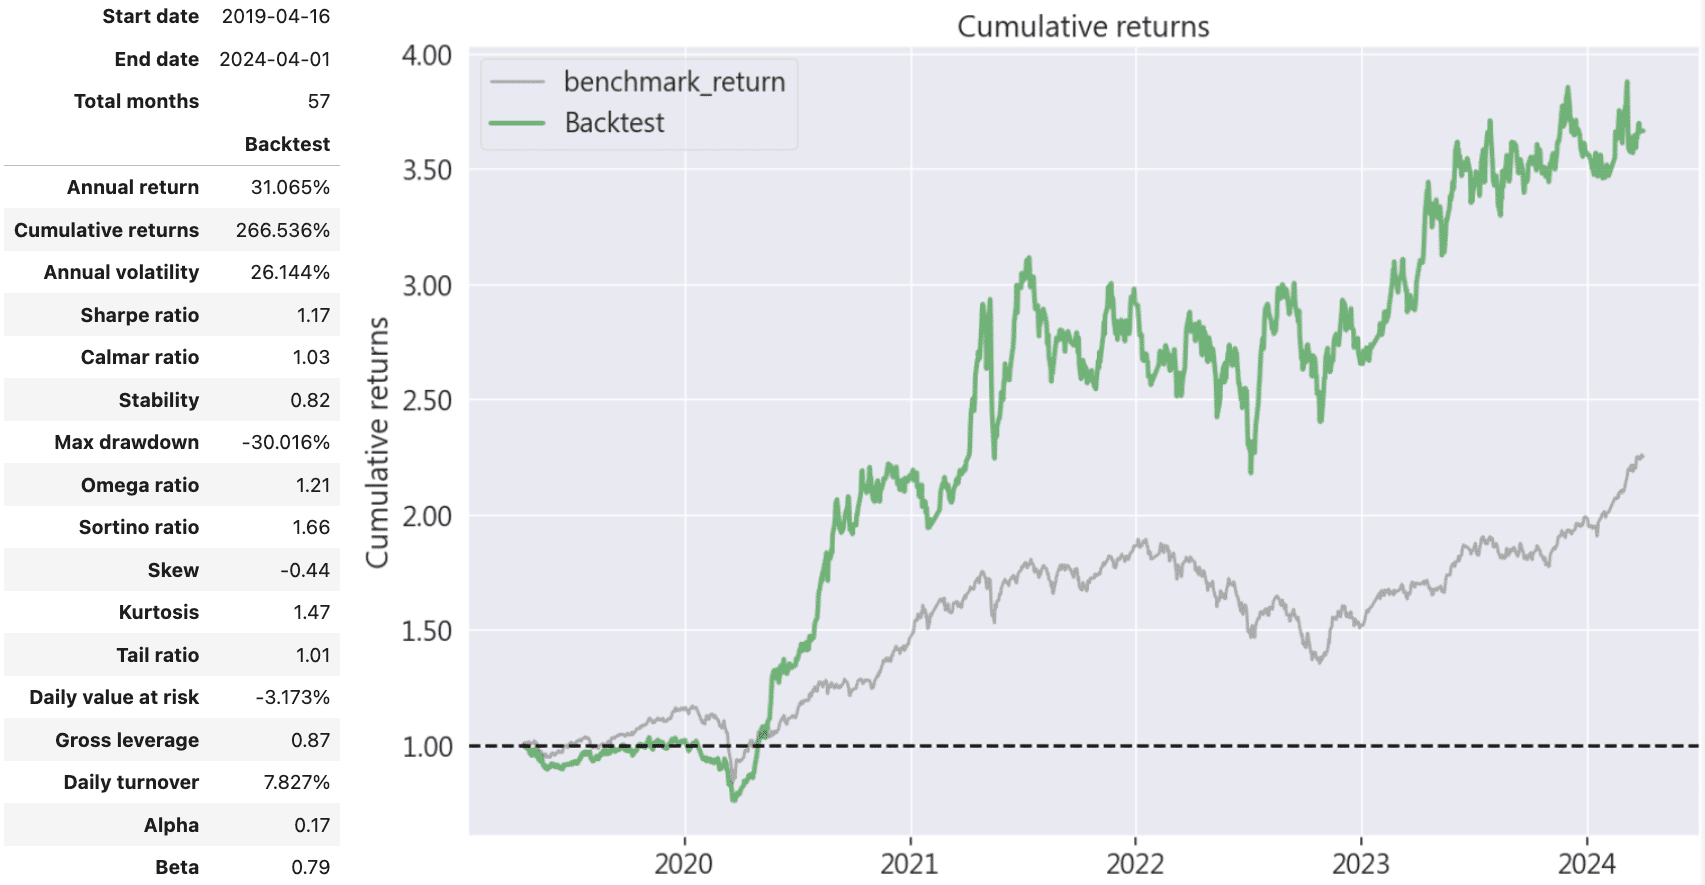
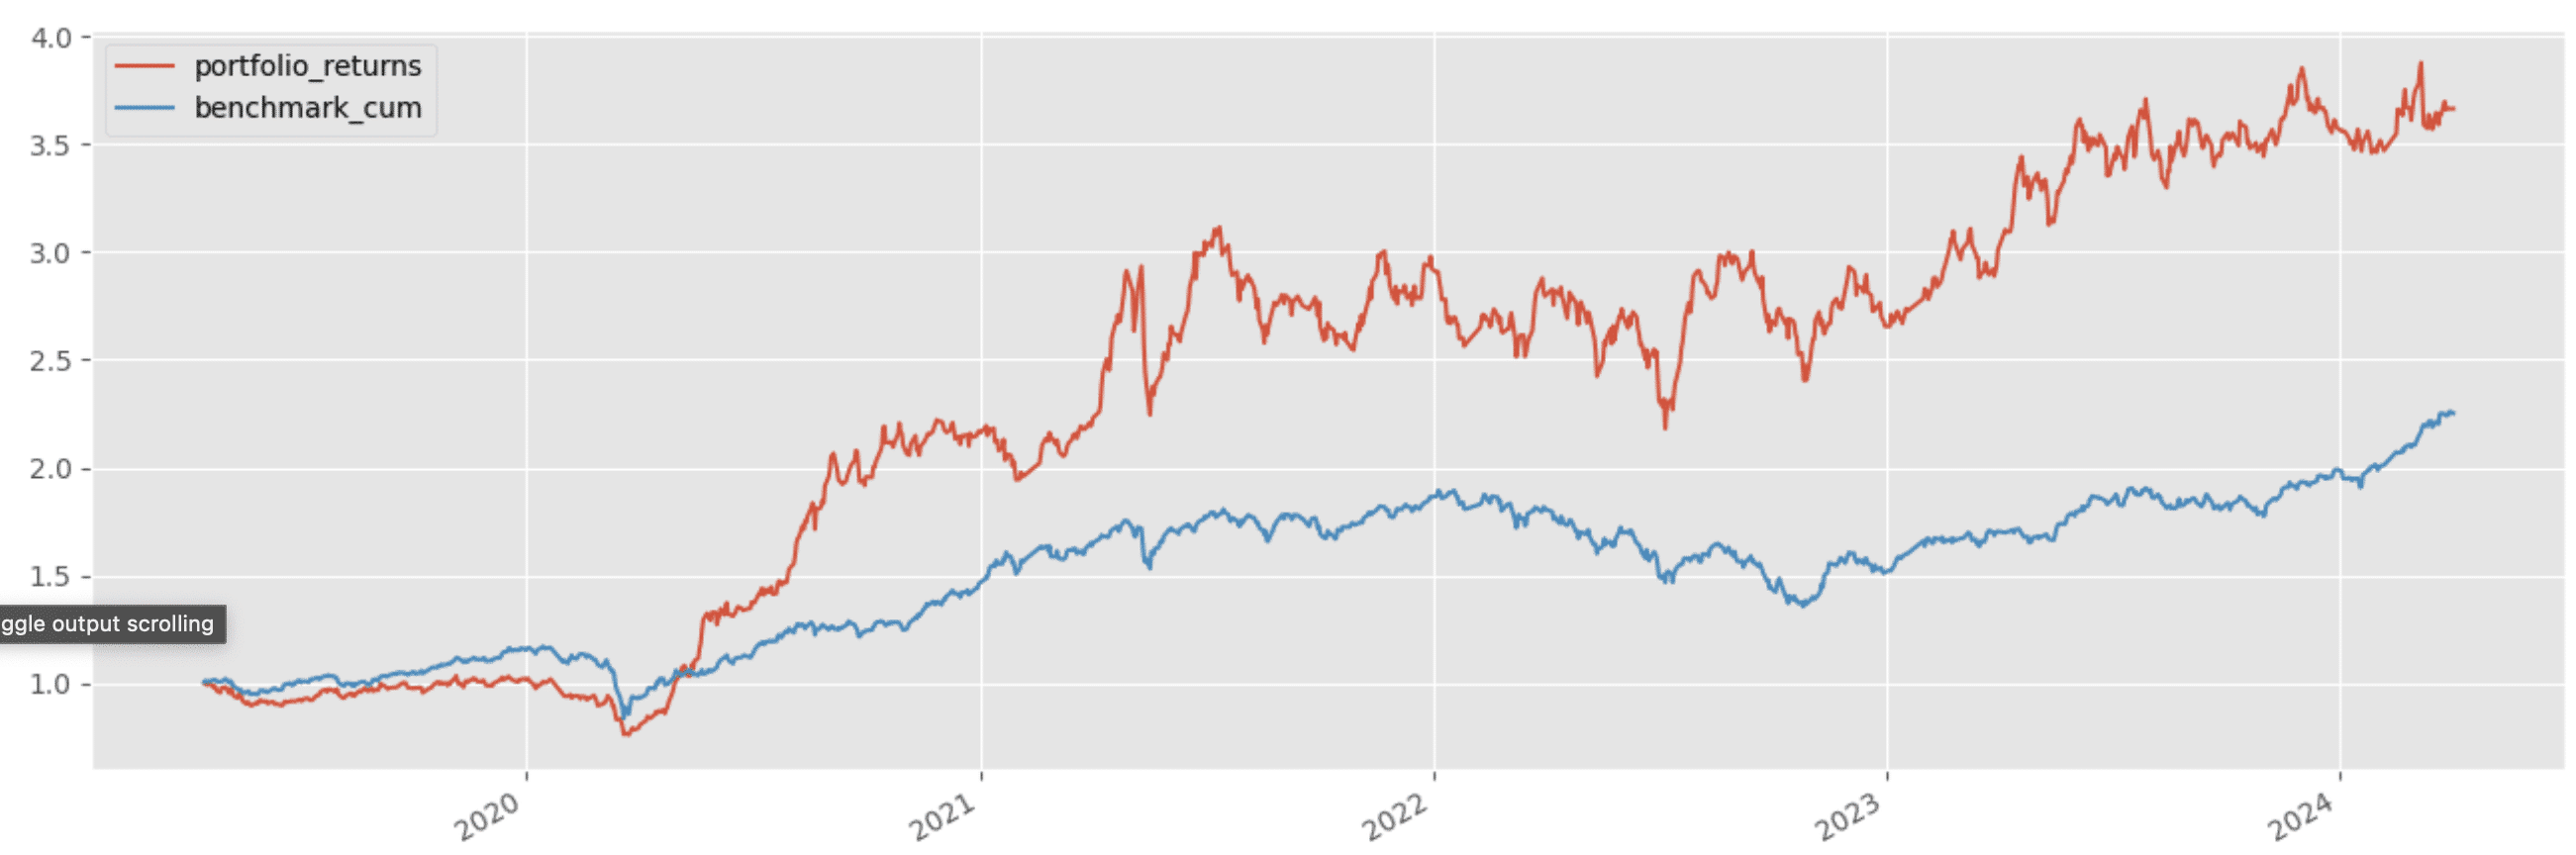
The momentum factor strategy achieved an annualized return of approximately 31.1% over these 57 months, with a cumulative return of 266.536%. Although there was a slight underperformance compared to the market in the initial stages, overall profitability was superior to the market. The beta value of 0.79 indicates that the strategy is less sensitive to market fluctuations, reflecting the core concept of trend following, which does not focus on overall market volatility or predict market directions. However, due to the strategy’s focus on stock price movements, it targets stocks breaking new highs, which intuitively results in higher volatility, reaching 26.1%. Although high, this volatility primarily trends upward, as indicated by the Sortino Ratio of 1.17, an ideal figure (a lower Sortino Ratio means higher negative returns per unit risk).
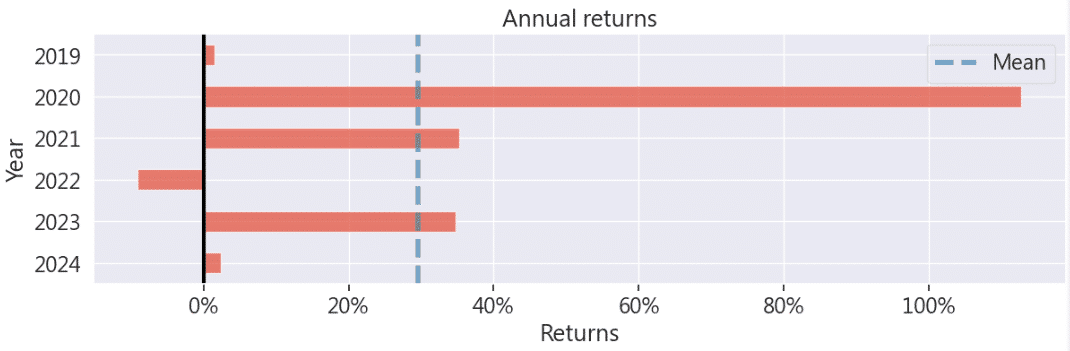
Apart from the bearish year of 2022, all other trading years showed positive returns.
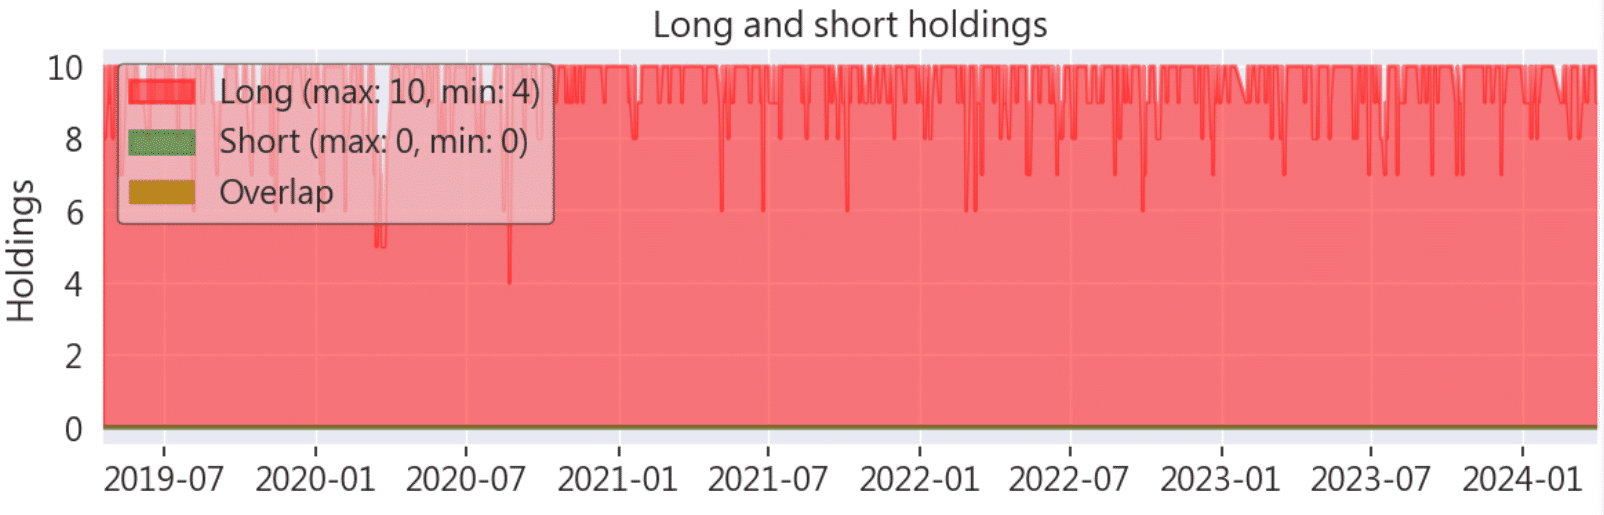
The chart of long and short position holdings indicates that, under the strategy’s setup with a maximum of 10 stocks, the number of holdings mostly stayed around 10, with a minimum of 4.
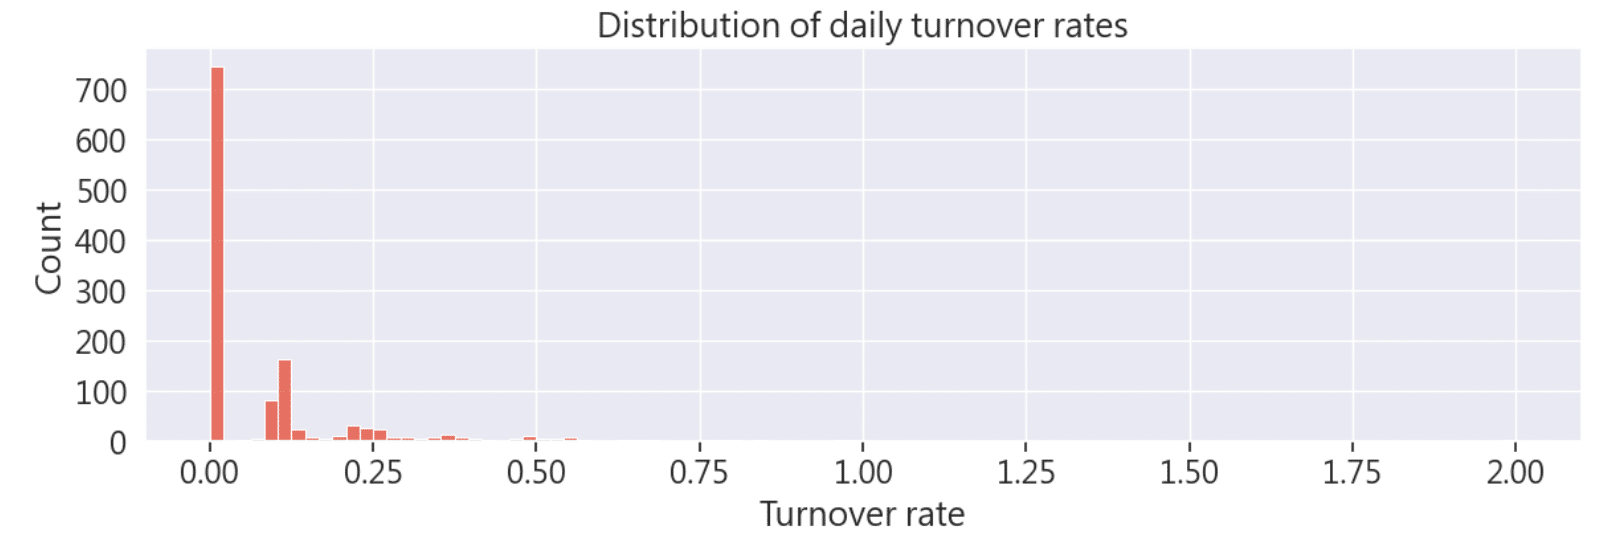
Due to daily rebalancing, the turnover rate was occasionally high, warranting attention to transaction fees.
This strategy applies the research of Cole Wilcox and Eric Crittenden (2005) to verify the profitability of trend following in the Taiwanese stock market, yielding the following results:
Investors are welcome to refer to this strategy. We will continue introducing various indicators constructed using the TEJ database and backtest their performance. Readers interested in various trading backtests are encouraged to consider TQuant Lab‘s related packages to build their trading strategies using high-quality databases.
Disclaimer: This strategy is for reference only and does not represent any product or investment advice.
“Taiwan stock market data, TEJ collect it all.”
The characteristics of the Taiwan stock market differ from those of other European and American markets, and the dynamics of retail investors are worth noting. Especially in the first quarter of 2024, with the Taiwan Stock Exchange reaching a new high of 20,000 points due to the rise in TSMC’s stock price, global institutional investors are paying more attention to the performance of the Taiwan stock market.
Taiwan Economical Journal (TEJ), a financial database established in Taiwan for over 30 years, serves local financial institutions and academic institutions, and has long-term cooperation with internationally renowned data providers, providing high-quality financial data for five financial markets in Asia.
With TEJ’s assistance, you can access relevant information about major stock markets in Asia, such as securities market, financials data, enterprise operations, board of directors, sustainability data, etc., providing investors with timely and high-quality content. Additionally, TEJ offers advisory services to help solve problems in theoretical practice and financial management!
