Table of Contents
In Taiwan stock market, structured data such as financial reports and stock prices are easily accessible. However, what truly drives short-term volatility are events. From company announcements and regulatory releases to media reports, every piece of information can sway investor sentiment and capital flows. Traditional financial data, however, often fails to capture these real-time reactions, making it difficult for investors to determine which events are actually priced in by the market.
TCRI Watchdog (WD) database was developed precisely to address this gap. TEJ transforms scattered announcements and news events into quantifiable credit risk signals, enabling investors to systematically grasp the market’s true reactions to events.
This article focuses on material information events disclosed via the Market Observation Post System (MOPS). Using the Event Study Methodology, it analyzes how the market responds to events of varying intensity (from –3 to +3). The findings reveal that bad news tends to trigger sharper and longer-lasting price reactions than good news, and further demonstrate how TCRI Watchdog serves as a core alternative data tool for investment decision-making and risk monitoring.
➡️ Get Detail about alternative data-TCRI Watchdog Database.
In a market where information moves rapidly, investors need more than just the knowledge that an event occurred—they need to quantify its market impact. TCRI Watchdog (WD) converts unstructured textual data—such as company announcements, regulatory disclosures, and news—into observable, comparable, and traceable event signals known as Event Intensity scores.
Each day, TCRI WD captures events involving all listed and OTC companies in Taiwan (including delisted firms), from sources including:
Each event is reviewed and validated through both TEJ’s analyst team and AI-driven modeling, and then assigned an event intensity score from –3 to +3 based on its potential impact on corporate credit risk. Events are further categorized into 5 dimensions and over 100 subtypes:
Table1: 5 dimension of TCRI Watchdog event
| Code | Event Type | Description |
|---|---|---|
| A | Accounting / Financial Reporting | Events related to accounting, financial disclosures, or restatements, reflecting financial transparency and stability. |
| I | Industry Prospects | Events tied to business operations, capacity, costs, R&D, or fundraising, reflecting industrial trends and business momentum. |
| M | Management / Governance | Includes governance issues, director and executive changes, internal control failures, fraud, labor disputes, and cybersecurity incidents. |
| F | Market Transactions | Covers credit rating changes, stock price anomalies, capital market transactions, and listing status changes. |
| R | Crisis Events | Financial distress, defaults, delistings, or bankruptcies—the most direct indicators of credit risk. |
This structure allows investors to quantify the nature and direction of market events under a unified framework, enabling consistent comparisons—whether monitoring individual stock risks or assessing overall market sentiment.
MOPS announcements are the primary channel for Taiwans listed firms to disclose financial and operational updates. Whether it’s a new investment, board change, bond issuance, or restated financial report, such events often trigger significant market responses.
This study uses TCRI Watchdog database, analyzing over 33,000 MOPS-based events from 2018 to 2025 to examine the relationship between event intensity and abnormal returns (AR), as well as the asymmetry in market reactions to positive and negative news.
Scope and Parameters:
Grouping events by intensity allows us to examine whether the market exhibits systematic reaction patterns—such as pre-event drift, delayed reaction, or post-announcement adjustment—depending on the nature of the information.
Table2:Definition of Event Intensity Groups
| Group | Event Intensity Condition |
|---|---|
| negative | <0 |
| -1 | =-1 |
| -2 | =-2 |
| -3 | =-3 |
| positive | >0 |
| 1 | =1 |
| 2 | =2 |
| 3 | =3 |
| neutral | =0 |
This study applies the Event Study Methodology to evaluate abnormal stock performance before and after the announcement date, relative to an expected normal return. The research settings are as follows:
📌 You may intetesting:Discovering Investment Factors through PIT Audited Financial Database
The analysis shows a clear and asymmetric pattern: negative news leads to significantly larger and longer-lasting declines than the gains produced by positive news.
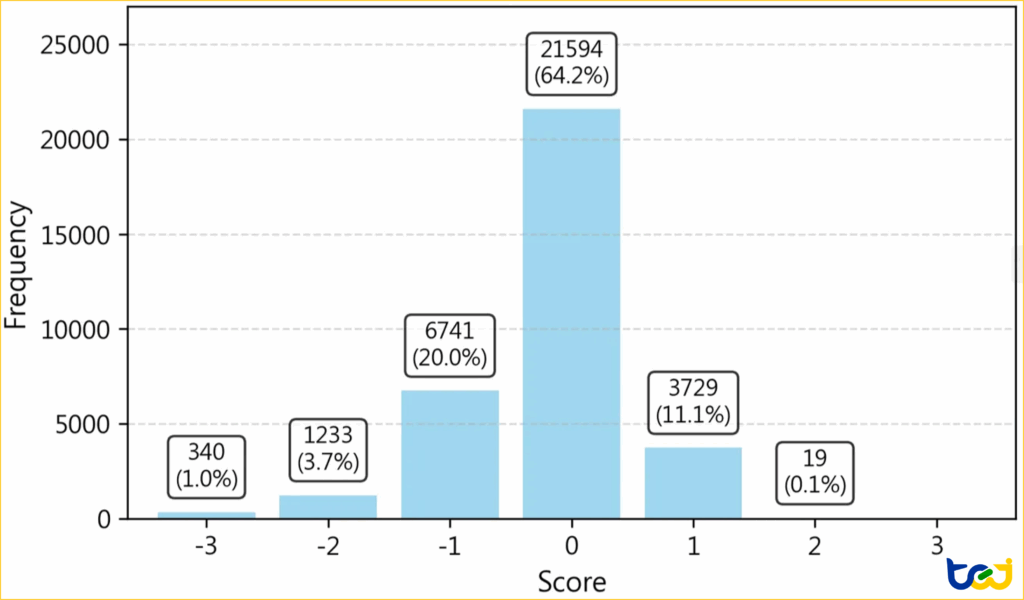
As shown in Figure 4-1, most announcements are neutral (score 0) or mildly negative (–1), with –1 to –3 events accounting for roughly one-fourth of all samples. While the majority of information is normal, extreme events hold significant market insight.
Figure 1:Event Distribution Chart
Further analysis shows a negative correlation between event intensity and returns, meaning the stronger the negative intensity, the sharper the price decline.
Table3:Detailed Statistical Results
| Group | Event Count | Mean AAR (%) | Final CAAR(%) | Significance |
|---|---|---|---|---|
| -1 | 6741 | -0.09% | -1.90% | *** |
| -2 | 1233 | -0.23% | -5.12% | *** |
| -3 | 340 | -0.54% | -11.40% | *** |
| 1 | 3729 | 0.06% | 1.34% | *** |
| 2 | 19 | 0.06% | 1.19% | |
| negative | 8314 | -0.10% | -2.12% | *** |
| neutral | 21594 | 0.00% | 0.05% | |
| positive | 3748 | 0.06% | 1.34% | *** |
Market behavior indicates that prices often react before the official announcement. In –3 (strongly negative) events, around 56% of the total drop occurred before the disclosure date (t–1).
Event-Day Reaction (t=0):
Score -3 events on the announcement day (t=0), abnormal returns (AAR) averaged –1.7%, signaling new negative information but slightly easing compared to the pre-event decline.
Post-event Drift:
Post-announcement drift persisted, with continued declines over the following 10 days—an additional –3.35% for –3 events.
Conversely, positive news(+1 and +2) often saw pre-event rallies followed by mild corrections after announcements, suggesting that the market anticipates good news but reverts afterward.
Table 4:Effect Distribution Table
| Group | CAAR (t-1)% | CAAR (t=0)% | CAAR (t+10)% | AAR (t-1)% | AAR (t=0)% | Pre% Pre-event Ratio | t=0 Ratio | Post-event Ratio % | Marginal Effect % | Post-Event Return% |
|---|---|---|---|---|---|---|---|---|---|---|
| -1 | -1.32 | -1.41 | -1.90 | -0.41 | -0.09 | 69.7 | 4.7 | 25.6 | -78.2 | -0.48 |
| -2 | -2.65 | -3.31 | -5.12 | -1.19 | -0.67 | 51.8 | 13.0 | 35.2 | -44.1 | -1.80 |
| -3 | -6.35 | -8.05 | -11.40 | -2.13 | -1.70 | 55.7 | 14.9 | 29.4 | -20.2 | -3.35 |
| 1 | 1.53 | 1.63 | 1.34 | 0.89 | 0.10 | 114.2 | 7.4 | -21.6 | -88.8 | -0.29 |
| 2 | 3.35 | 4.06 | 1.19 | 2.75 | 0.71 | 281.9 | 60.2 | -242.1 | -74.0 | -2.87 |
| negative | -1.43 | -1.65 | -2.12 | -0.57 | -0.21 | 67.5 | 10.1 | 22.4 | -62.3 | -0.48 |
| neutral | 0.30 | 0.33 | 0.05 | 0.21 | 0.02 | 555.8 | 42.9 | -498.7 | -89.0 | -0.27 |
| positive | 1.53 | 1.63 | 1.34 | 0.89 | 0.11 | 113.5 | 7.8 | -21.4 | -88.2 | -0.29 |
Figure 2:Group Comparison Chart
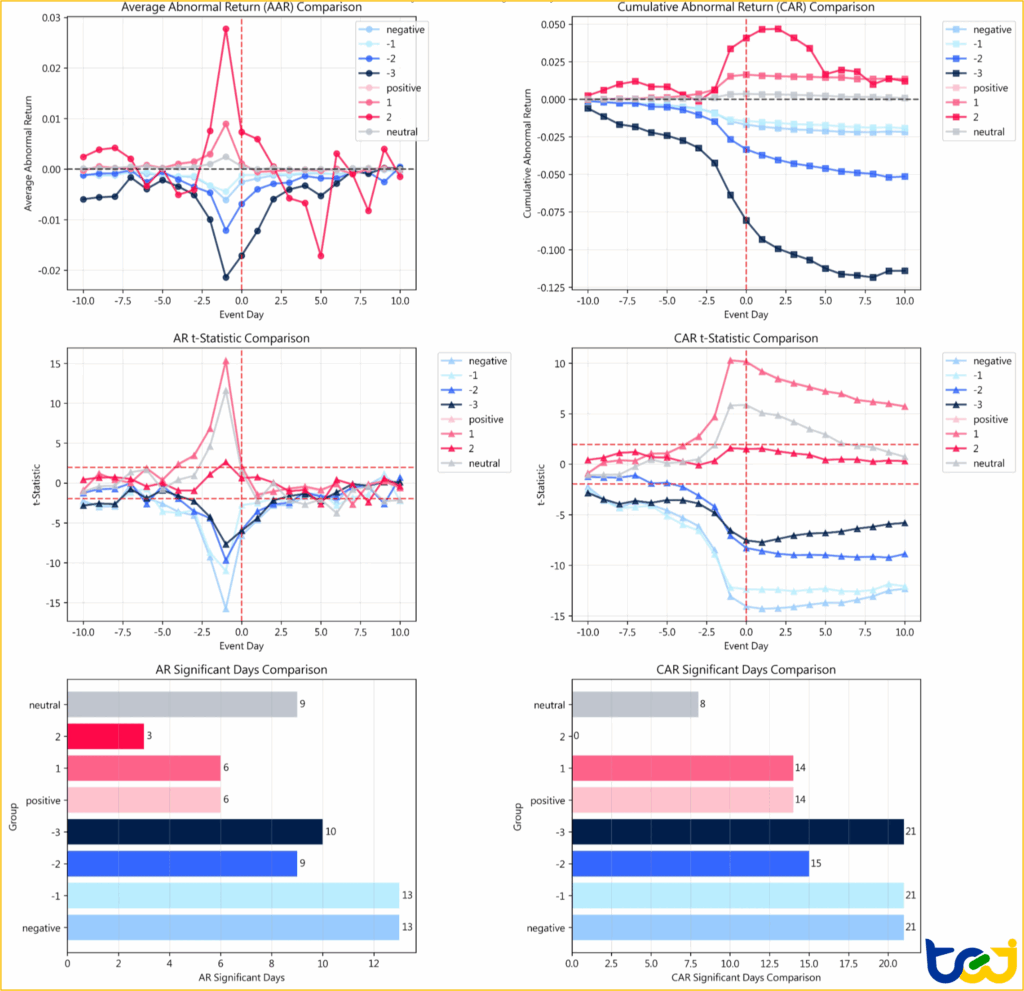
These findings clearly illustrate the behavioral characteristics of Taiwan’s equity market: investors respond to bad news more quickly and persistently, while reactions to good news are more emotional and short-lived.
This asymmetry highlights the value of TCRI Watchdog’s event intensity data—not only does it reveal the surface-level content of announcements, but it also quantifies how quickly and in what structure the market absorbs information. This enables investors to detect potential risks earlier or leverage delayed reactions to design more precise trading strategies.
📌 You may intetesting:Discovering Investment Factors through PIT Audited Financial Database
The first part of our analysis highlights a clear and asymmetrical pattern in Taiwan’s equity market: negative events carry stronger and more persistent impacts than positive ones, and a significant portion of this reaction occurs even before the announcement becomes public. By quantifying these dynamics through TCRI Watchdog’s Event Intensity framework, investors gain a more objective and timely understanding of how information is absorbed and priced by the market.
This allows market participants to identify risks earlier, monitor behavioral signals more effectively, and design strategies that account for both pre-event movements and post-event drift.
To deepen this understanding, the next part of our study classifies announcement events into five major categories. By examining how each category influences stock prices differently, investors can more precisely capture the market’s reaction structure and better distinguish which types of information truly drive risk and return.
👉 Continue to Part 2 — How the 5 Event Categories Shape Market Reactions