
Table of Contents
In our previous article” Shipping Leads, Semiconductors Follow? “we identified a recurring pattern in Taiwan’s market: rallies in the shipping sector often precede gains in semiconductor stocks. This article builds on that insight by transforming the observed rotation sequence into a quantitative investment strategy.
By combining sector momentum signals, macroeconomic indicators, and rule-based allocation logic, we construct a backtesting model to simulate historical trades. The goal is to evaluate whether this “Shipping → Semiconductors” signal—when used within a broader economic context—can deliver consistent excess returns.
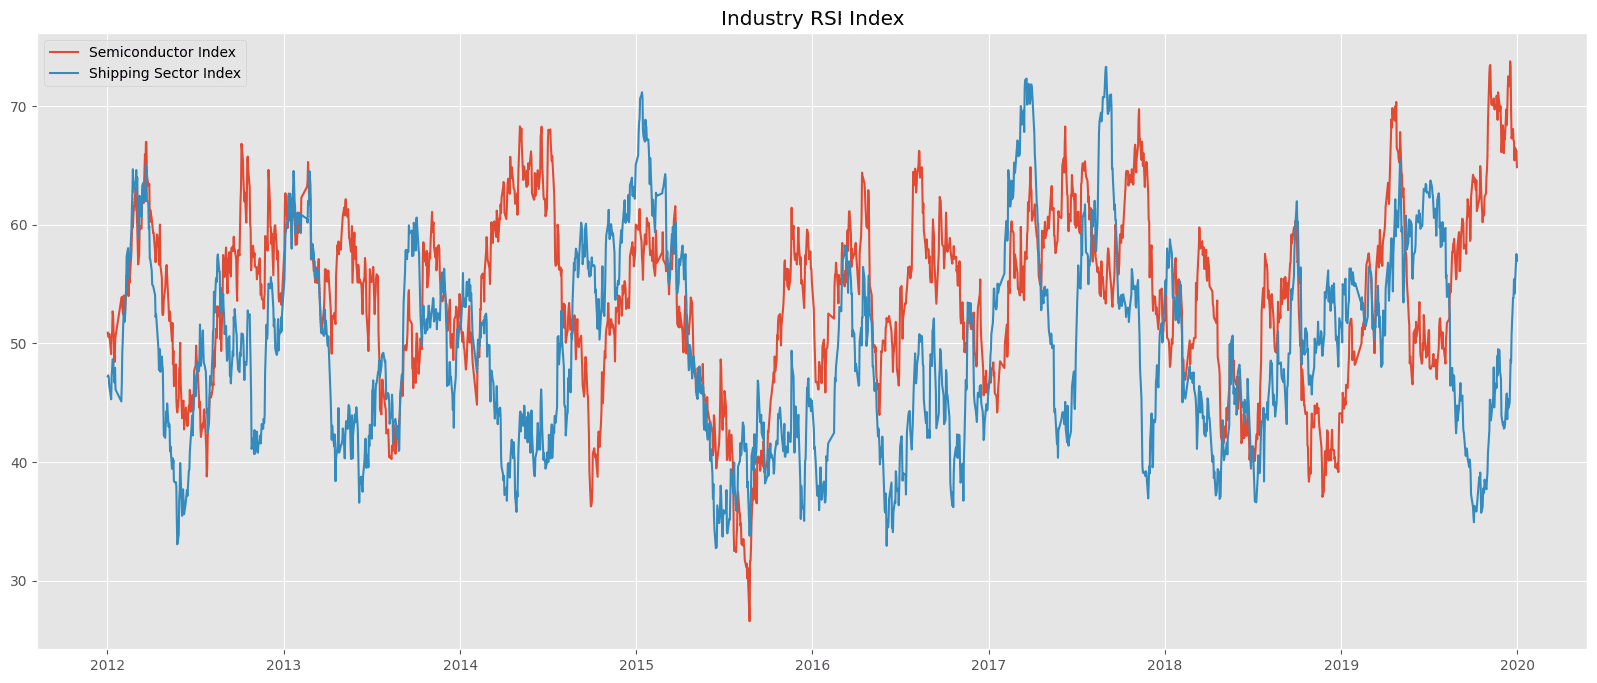
From the analysis presented in the previous article, covering the period from 2012 to early 2020, we can observe a clear rotational relationship between the RSI values of the shipping and semiconductor industries. The next step is to consider how we can leverage this rotational pattern to design a reliable investment strategy. To avoid look-ahead bias, we use post-2020 market data as the subject of our backtesting research, which makes our strategy analysis more robust.
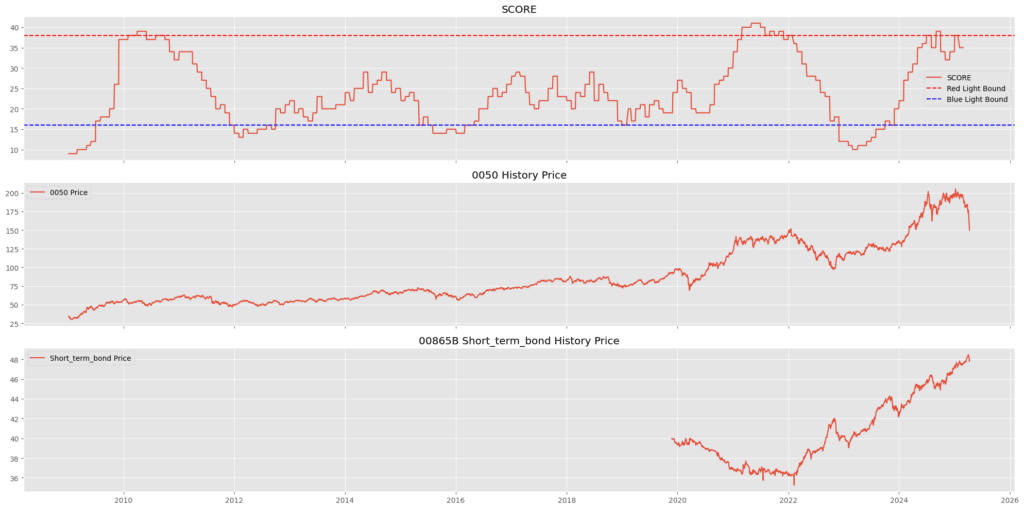
From the article “From Business Cycle Signal Lights to Asset Rotation”we learned that monitoring indicators can effectively help avoid bear market volatility—holding equities only during bull markets and switching to short-term government bonds or other defensive assets during bear markets—while producing favorable backtesting results.
Incorporating the observed sector rotation phenomenon “Shipping → Semiconductors,” our strategy proposes that during bull market phases, once a sector rotation signal is detected, the originally held 0050 ETF is temporarily substituted with semiconductor-related stocks. After capturing the excess returns generated from capital rotation, the position is rotated back into the 0050 ETF. The expectation is that this dynamic allocation approach will further enhance the performance outcomes discussed in the earlier study. For benchmarking, the strategy is compared against the TAIEX Total Return Index (IR0001), hereafter referred to as the market index.
Operational Logic:
The strategy activates under two conditions: a bullish macroeconomic phase and a sector rotation signal.
When the monitoring indicator signals an upward phase, if the RSI value of the shipping index rises above 65 (indicating that the sector is at a relative high point and the rotation cycle is likely beginning), we initiate positions in representative semiconductor-related stocks.
The holdings are maintained until the RSI of the semiconductor index increases by 15 points relative to the entry level (signaling the end of the rotation), at which point the semiconductor positions are closed and rotated back into the 0050 ETF.
If the market transitions into a bear phase before the rotation cycle completes, all equity positions are liquidated and shifted into short-term bonds, consistent with the design outlined in the business cycle strategy.
Semiconductor Allocation:
For exposure to the semiconductor sector, we construct a basket of ten representative Taiwan’s semiconductor companies, spanning the full supply chain from upstream foundries to midstream IC design and downstream packaging, testing, and memory:
These stocks collectively form the key structure of Taiwan’s semiconductor industry, while also possessing sufficient liquidity and market capitalization, making them suitable for empirical backtesting and portfolio allocation simulations.
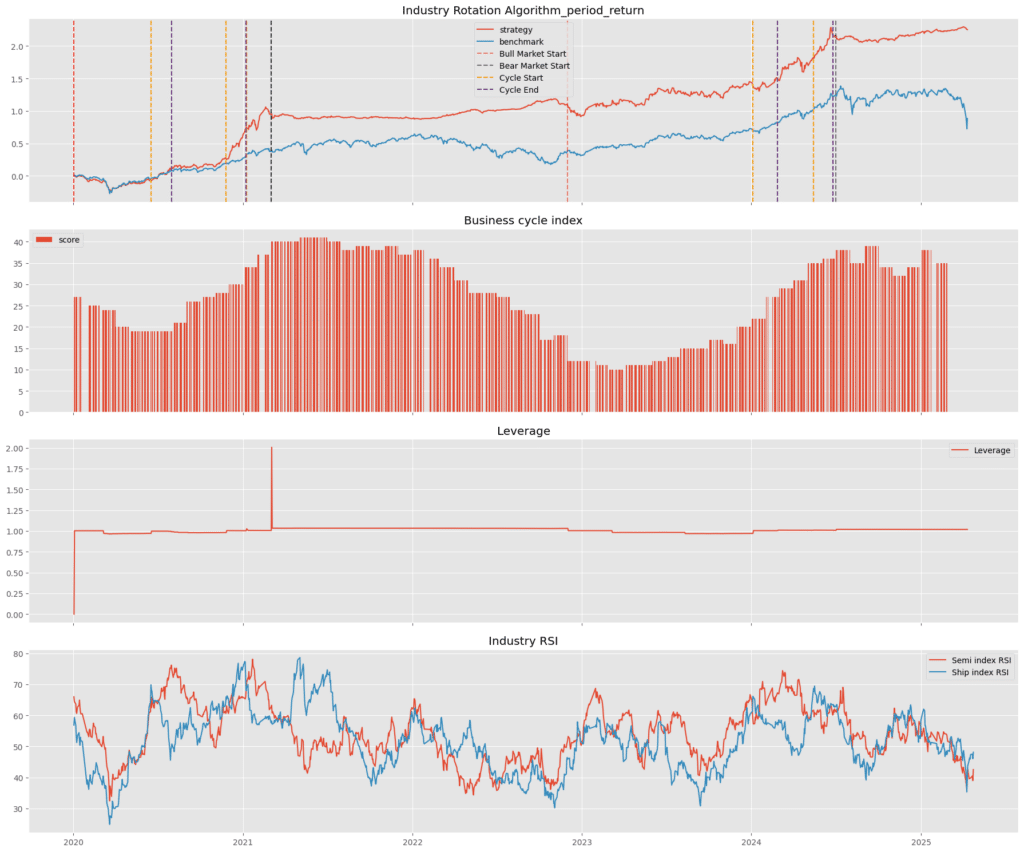
The first performance chart highlights 5 instances of the “Shipping → Semiconductor” rotation signal (marked in orange) detected during the recent bull market. Among them, 4 signals (2nd to 5th) successfully captured strong rallies in semiconductor stocks. The 2nd and 3rd signals—both in 2020—generated the most substantial gains, helping the strategy meaningfully outperform the TAIEX benchmark. While the 4th and 5th signals also aligned with semiconductor uptrends, their marginal outperformance was more limited, as semiconductors had already become the market’s primary growth driver by then.
The second chart overlays the business cycle score throughout the backtesting period. Most entry points aligned with the early expansion or recovery phases of the cycle, supporting the strategy’s timing logic: capital rotation tends to accelerate as economic conditions improve.
The third chart presents leverage utilization. Aside from two short-lived spikes to 2.0—caused by portfolio rebalancing during bear transitions—leverage remained close to 1.0 throughout. This indicates that the strategy’s returns were not driven by excessive leverage, and associated risks were well-contained.
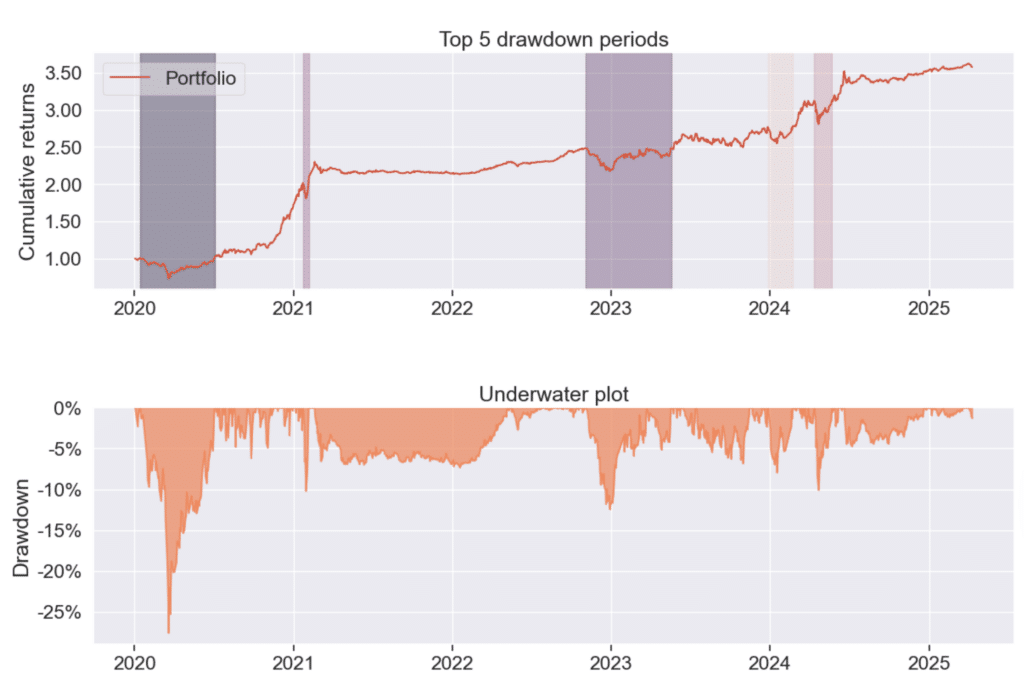
Finally, the drawdown chart shows that losses were generally limited to within –10%, reflecting strong downside control. The only major exception occurred during the COVID-19 shock in early 2020, when the portfolio—primarily holding the 0050 ETF—faced a temporary drawdown of –27%. This episode, driven by a black swan event, does not undermine the overall resilience of the strategy.
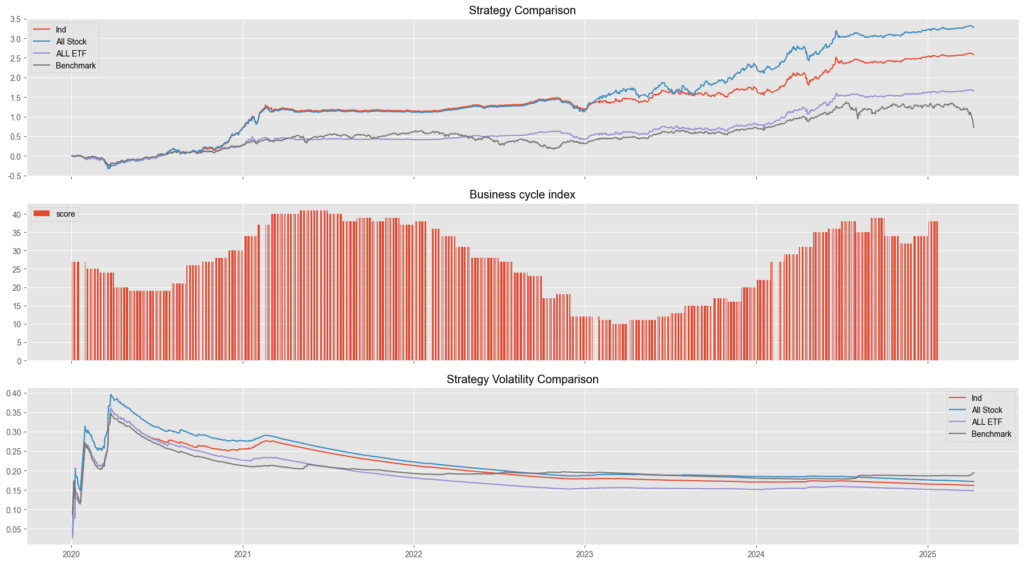
The chart above presents a comparison of the performance and risk of four different strategies during the backtesting period.
From the cumulative return chart, the all-stock strategy (blue line) achieved the highest total return, but at the cost of significantly higher volatility. This is confirmed in the volatility chart, where its risk exposure remained consistently elevated across the backtest period.
In contrast, the Industry Rotation Strategy (red line) proposed in this study demonstrated stable performance with effective risk control. While its return was slightly lower than the all-stock strategy, it clearly outperformed the ETF-only and benchmark strategies. Volatility was also kept at moderate levels—between the all-stock and all-ETF approaches—striking a healthy balance between upside potential and drawdown management.
Importantly, the rotation strategy showed no signs of performance degradation due to rebalancing. On the contrary, its ability to detect capital flows and time entry/exit decisions contributed to a smoother equity curve, demonstrating real-world applicability for long-term investors.
Strategy Comparison Table and Analysis
| Performance Indicators / Strategies | Industry Rotation Strategy | Bull Market Semiconductor Strategy | Bull Market 0050 Strategy | Benchmark |
|---|---|---|---|---|
| Annualized Return | 28.58% | 33.23% | 21.24% | 12.047% |
| Cumulative Return | 257.52% | 327.48% | 165.40% | 77.97% |
| Annualized Volatility | 16.179% | 17.21% | 14.84% | 18.52% |
| Sharpe Ratio | 1.64 | 1.75 | 1.37 | 0.71 |
| Calmar Ratio | 1.04 | 0.98 | 0.77 | 0.45 |
| Maximum Drawdown Period | -27.60% | -34.07% | -27.60% | -26.74% |
| Alpha | 0.23 | 0.28 | 0.16 | 0 |
| Beta | 0.39 | 0.42 | 0.39 | 0.93 |
While the all-stock strategy achieved the highest return and Sharpe ratio, it also came with the largest drawdowns and volatility, making it more suitable for investors with higher risk tolerance.
In contrast, the Industry Rotation Strategy offers a more balanced profile:
Overall, the Industry Rotation Strategy successfully balances growth and risk, demonstrating its robustness as a practical and resilient investment approach.
Disclaimer: This analysis is for reference only and does not constitute any product recommendation or investment advice.
This study demonstrates how sector rotation signals—like the lead-lag between shipping and semiconductors—can be turned into a rules-based quantitative strategy with strong performance and controlled risk.
Behind every effective strategy is a reliable data foundation. TEJ offers high-quality, point-in-time datasets that power research, backtesting, and decision-making. Whether you’re building asset allocation models or sector-based signals, TEJ’s solutions help you move from idea to execution with confidence.
👉 Explore TEJ’s core data services:
Market Data Solution – Delivers comprehensive market insights, including stock prices, institutional buy-sell activity, major broker trading flows, margin trading data, and more.
Fundamental Data Solution – Offers structured, point-in-time company profiles to help you analyze a firm’s core operations and business fundamentals.
The Most Comprehensive Taiwan Market Data Analysis for Investors
From Business Cycle Indicators to Asset Rotation: A Quantitative Strategy to Avoid Bear Markets
Michael Murphy’s Risk Assessment Rules for Investing in High-Tech Stocks
Charles Brandes’ Value Investing Principles : Building a Portfolio with a Margin of Safety
