Table of Contents
In the Taiwan stock market, while structured data such as financial reports and price information are complete and highly real-time, short-term stock price fluctuations are often driven by “events.” From announcements and regulatory news to media reports, this unstructured information rapidly influences investor’s expectations and capital flows, yet it remains difficult to capture effectively using traditional quantitative methods.
Identifying influential signals from a vast array of events and extracting actionable signals from events and converting them into backtestable investment factors has always been a key threshold for quantitative research. TEJ developed the TCRI Watchdog (WD) database to transform unstructured information into structured alternative data through a systematic classification and scoring mechanism, assisting researchers in effectively capturing alpha and strengthening forward-looking risk judgment.
TCRI Watchdog (WD) processes unstructured information (such as news and announcements) into a structured alternative dataset, featuring consistent and comparable Event Scores (-3 to +3) based on their impact on corporate credit risk. Through systematic event definitions and automated quantitative processes,it converts raw narratives into quantifiable event signals suitable for backtesting and alpha generation.
Includes historical records from 2019 for all listed and OTC companies in the Taiwan market, including delisted companies.
Data is integrated from three major sources:
Event scores range from -3 to +3. Negative values represent potential deterioration in credit risk, while positive values represent risk improvement or operational benefits. The larger the absolute value, the more significant the event’s impact on corporate risk.
All events are categorized into the following 5 dimensions and over 100 subcategories, constructing a quantifiable credit event framework. Each event is classified through collaboration between analysts and AI models based on its impact on corporate operations and credit risk:
Table 1: 5 Dimensions of TCRI Watchdog Events
| Code | Event Category | Meaning | Sub-classification Examples |
| A | Accounting | Events related to financial reporting, accounting treatments, and disclosure practices, reflecting financial transparency and stability. | Alleged Fraud of financial report, Restatement of financial report Total:13 subcategories |
| I | Industry | Events related to operating environment, capacity, costs, R&D progress, and financing, revealing operating momentum and industry trends. | Issues of suppliers or agency, The loss of important talents Total:27 subcategories |
| M | Management | Events involving corporate governance, board and executive changes, internal or external fraud, labor disputes, information security, and internal control deficiencies, reflecting governance and management stability. | Suspicion of embezzlement or hollowing out of assets, Executive changes Total:41 subcategories |
| F | Market Trading | Events related to capital market trading, rating changes, abnormal price movements, and listing status, reflecting market perceptions of credit and liquidity. | Stock price manipulation, insider trading, Cross Shareholding Total:12 subcategories |
| R | Crsis | Events involving financial distress, default, delisting, or restructuring, representing the most direct signals of credit risk. | Rumored financial crisis, Bankruptcy Total:22 subcategories |
This framework establishes a unified standard, allowing investors to efficiently evaluate and compare various market events, ranging from individual stock risk monitoring to overall market risk sentiment assessment.
Data is delivered via API or FTP for automated transmission.
Figure1: TCRI WD data sample
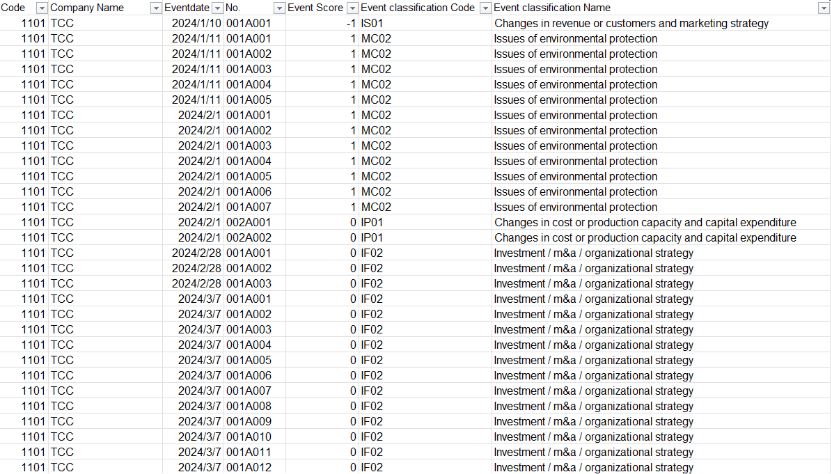
As shown in the data sample, WD precisely defines fragmented market announcements as structured records featuring Event date, Event Score, and Event classification.
According to Figure 2, the system generates an average of over 3,500 structured credit signals monthly. This steady, high-density data stream is ideal for quantitative modeling and stress testing due to its frequency and depth.
Figure 2: Monthly distribution of TCRI Watchdog events
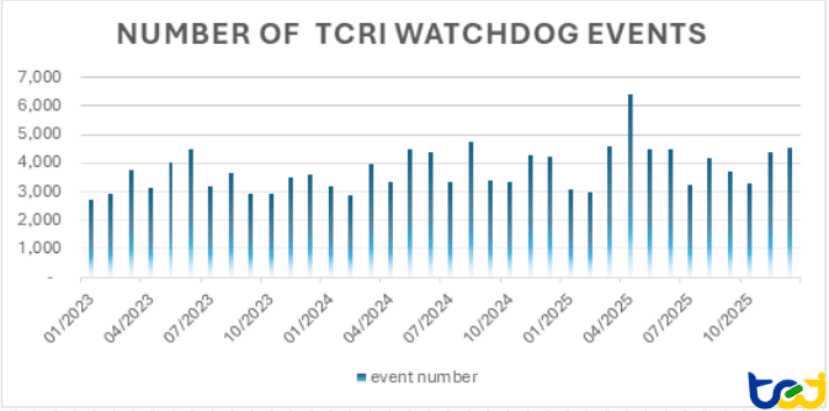
Source:TEJ TCRI WD database
Period:Jan 2023~ Dec 2025
The failure of quantitative strategies often stems from underlying data containing too much noise unrelated to credit risk, causing true early-warning signals to be diluted or obscured. TCRI Watchdog (WD) assists research teams in skipping tedious data cleaning to focus on alpha mining, while enabling investment teams to integrate event risks into decision frameworks for better precision and efficiency.
Provides a standardized scoring system from -3 to +3 for diverse unstructured events. This solves the difficulty of cross-sectional comparisons caused by a lack of quantitative benchmarks in original announcements.
Filters core information relevant to corporate operations through automated algorithms and dual review by the TEJ professional team. Unlike generic AI tools, WD strictly removes emotional noise, significantly reducing manual labeling time for analysts.
Strictly follows the PIT architecture, recording the precise timestamp of every event disclosure and including historical data of delisted companies. This eliminates look-ahead bias and survivor bias in backtesting, ensuring model authenticity.
According to TEJ’s ten-year backtest, market reactions to non-financial information depend on the event’s category and intensity rather than news volume.
Empirical evidence shows a significant “advance reaction” to strongly negative news (e.g., -3 points). Stock prices often show abnormal declines before the news is officially reported, with the downward trend expanding further after disclosure.
Market reactions to management and governance announcements are not instantaneous. Even if news leaks beforehand, stock prices continue to fall following the official announcement.
Turning Alternative Data into Alpha Signals!
WD transforms events into structured data and quantitative factors, allowing alternative data to be integrated into models and backtests. Investors can adjust positions before the market fully reflects the information, turning event signals into forward-looking alpha.
⭐Discover more specialized financial datasets from TEJ!
