
Table of Contents
In the field of growth investing, Derwood S. Chase Jr. is undeniably a legendary and representative figure. With an investment career spanning nearly half a century, Chase held a strong academic background—graduating from the University of Virginia and earning an MBA from Harvard Business School in 1954. In 1958, he founded Chase Investment Counsel Corporation, a firm focused on managing corporate pension funds, trust funds, and individual retirement plans, deliberately avoiding any banking-related business. Under his leadership, the firm managed over $1.4 billion in assets by 2001. From 1990 to 2001, its institutional large-cap growth portfolio achieved an impressive annualized return of 16.38%, significantly outperforming the S&P 500 and the Russell 1000 Growth Index over the same period.
In 1997, Chase further launched the Chase Growth Fund, which also delivered outstanding performance. By the end of 2001, the fund had achieved a 4-year average annual return of 9.88%, well above the S&P 500’s 5.65%, ranking sixth among 743 peer funds and earning the highest Morningstar rating of five stars.
Derwood Chase regarded himself as a risk-conscious GARP (Growth at a Reasonable Price) investor. His stock selection philosophy integrated quantitative research, technical analysis, and fundamental analysis, while emphasizing the importance of diversification. He believed that an ideal portfolio should contain 35 to 45 stocks. Through a strategy that combined growth and stability, Chase established a long-term return model that could endure across market cycles, providing a benchmark for investors navigating volatile markets.
Derwood Chase’s stock selection criteria integrated company size, growth potential, profitability, valuation, and momentum. He preferred large-cap companies with above-average market capitalization to reduce liquidity and operational risks. His selections emphasized firms with high earnings growth over the past five years and strong return on equity (ROE), indicating solid growth and operational efficiency.
To avoid overpaying for growth, he imposed a valuation ceiling—specifically, the forward P/E ratio should not exceed twice the earnings growth rate. Additionally, he incorporated relative price strength to capture market momentum and investor sentiment. These criteria, combined with a below-average debt ratio, formed a strategy focused on “reasonable growth, financial stability, and momentum-driven execution
According to Derwood Chase’s investment methodology, his stock selection logic integrates a company’s fundamental strength, growth potential, market performance, and financial soundness. The specific criteria are as follows:
Backtesting Period: 2016-01-01 to 2025-05-27
Rebalancing Frequency: Every 30 trading days
Benchmark Index: IR0001 (referred to as “Market Index”)
| coid | roi | mktcap | r505 | r104 | per | close_d | r316 |
| Stock Coid | Daily Return | Market Value | Current Ratio | ROE | PE ratio | Close price | EPS |
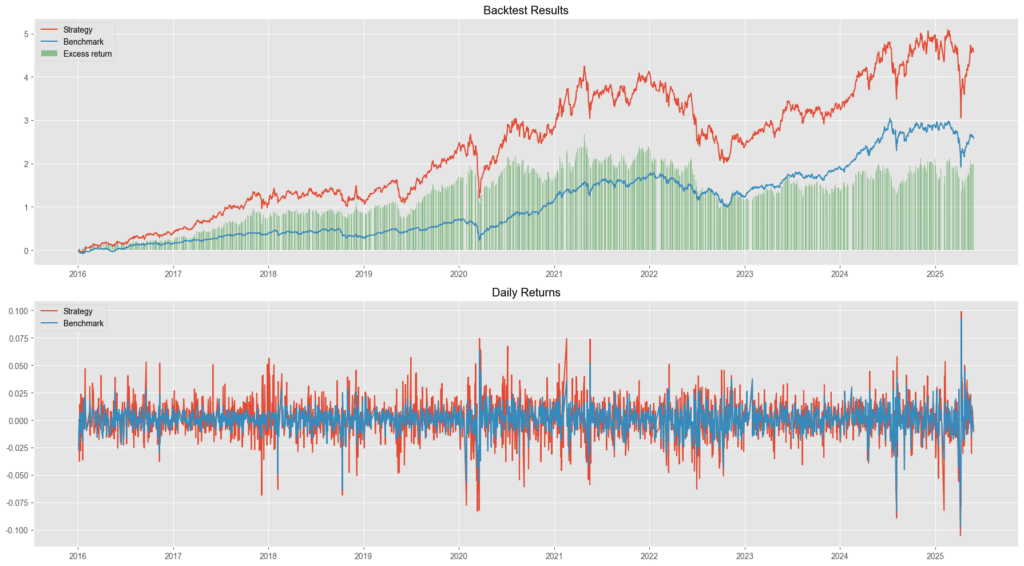
From the first chart titled “Cumulative Return”, it is evident that the strategy outperformed the market index. The cumulative return of the strategy reached 457.54%, compared to 241.5% for the benchmark, demonstrating strong profitability.
The chart also shows that the strategy tends to perform better during market uptrends—these are the periods when the return gap between the strategy and the market widens. However, during market consolidations or downturns, the strategy often experiences larger drawdowns.
This pattern is further confirmed in the second chart showing “Daily Returns”, where the strategy exhibits higher volatility compared to the benchmark throughout most of the period. This is also reflected in the strategy’s Beta of 1.27, indicating higher sensitivity to market movements, while the Alpha is only 0.03, suggesting that most of the excess return is derived from taking on additional market risk, rather than pure alpha generation.
These findings imply that the strategy’s effectiveness is market condition-dependent and may not be suitable for all market environments. Dynamic adjustment or conditional application based on market trends would enhance its practical utility.
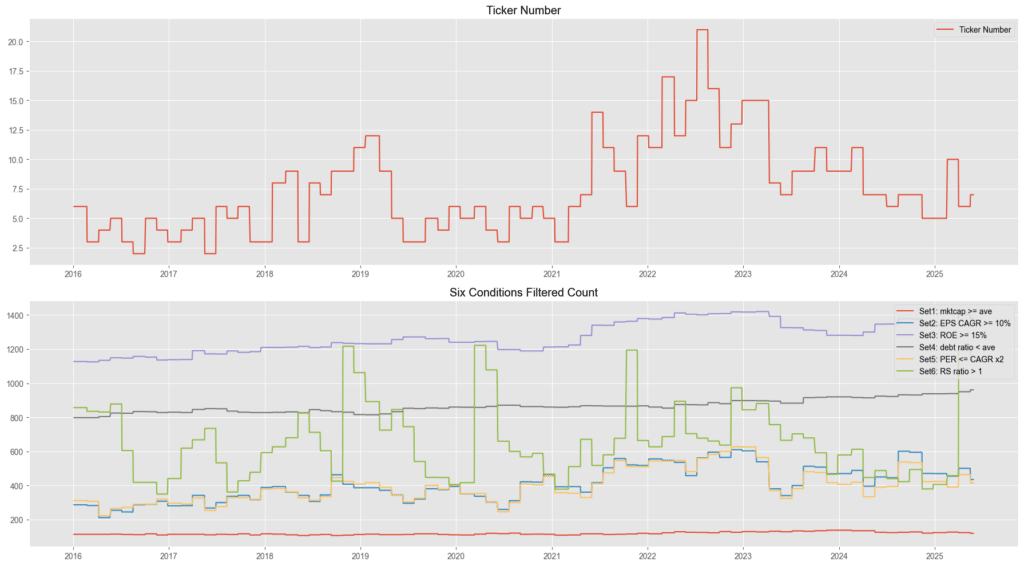
From the chart above, the first graph illustrates the number of stocks held by the strategy over time, while the second graph shows the number of stocks that passed all selection criteria at each point in time. A stock must simultaneously meet all six screening conditions to be selected and held by the strategy.
It is evident that the dominant screening factor is Set 6 — “6-Month Relative Strength (6M RS) > 1”. This condition plays a key role in the strategy and is the main reason it is classified as a momentum-based approach. This emphasis on momentum also appears to be the primary driver behind the strategy’s high exposure to market risk.
On the other hand, the number of stocks held during the backtest period rarely exceeded 20, which suggests limited diversification. Such a concentrated portfolio increases the likelihood that overall performance may be heavily influenced by a few individual stocks, thereby exposing the strategy to higher idiosyncratic (unsystematic) risk.
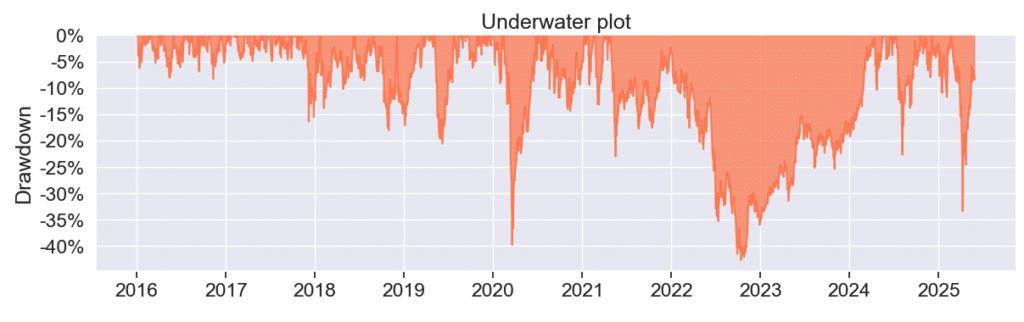
Based on the backtesting results, the strategy experienced notable drawdowns in 2018, 2022, and 2025, indicating that during bearish market conditions, the strategy tends to amplify market losses.
Overall, while the strategy delivered impressive returns over the long term, it remains exposed to significant drawdown risk during periods of extreme market stress.
| 項目 | 德伍.卻斯投資策略 | 大盤 IR0001 |
| Cumulative Returns | 457.54% | 241.54% |
| Annual Return | 20.84% | 14.47% |
| Annual Volatility | 27.79% | 16.22% |
| Sharpe ratio | 0.82 | 0.92 |
| Calmar Ratio | 0.49 | 0.53 |
| Max Drawdown | – 42.61% | – 27.37% |
| Beta | 1.27 | 0.99 |
| Alpha | 0.03 | 0 |
We welcome readers interested in various trading strategies to consider purchasing relevant solutions from Quantitative Finance Solution. With our high-quality databases, you can construct a trading strategy that suits your needs.
“Taiwan stock market data, TEJ collect it all.”
The characteristics of the Taiwan stock market differ from those of other European and American markets. Especially in the first quarter of 2024, with the Taiwan Stock Exchange reaching a new high of 20,000 points due to the rise in TSMC’s stock price, global institutional investors are paying more attention to the performance of the Taiwan stock market.
Taiwan Economical Journal (TEJ), a financial database established in Taiwan for over 30 years, serves local financial institutions and academic institutions, and has long-term cooperation with internationally renowned data providers, providing high-quality financial data for five financial markets in Asia.
With TEJ’s assistance, you can access relevant information about major stock markets in Asia, such as securities market, financials data, enterprise operations, board of directors, sustainability data, etc., providing investors with timely and high-quality content. Additionally, TEJ offers advisory services to help solve problems in theoretical practice and financial management!
The Wisdom of Blue-Chip Stocks: Howard Rosman’s Prudent Path to Wealth
Charles Brandes’ Value Investing Principles : Building a Portfolio with a Margin of Safety
From Business Cycle Indicators to Asset Rotation: A Quantitative Strategy to Avoid Bear Markets
