
Photo by Freepik
Table of Contents
According to the latest data compiled from 2023 annual reports of Taiwan’s listed companies by TEJ Group Observer, the total asset size of Taiwan’s top 100 business groups continues to grow, albeit at a significantly slower pace compared to previous years, with an annual increase of only 3%. Under the influence of the global economic downturn, the revenue and profit figures of these top 100 groups have shown a significant decline compared to 2022, with revenue falling by 7.9% and operating profit plunging by 25%.
In addition, TEJ categorized the top 100 groups based on their core businesses into financial, technology, and traditional industry groups. Among these, traditional industry groups exhibited the worst performance, with operating profit plummeting by 70% compared to 2022. This marks this sector’s second consecutive year of decline, with no signs of stabilization.
Beyond the abovementioned findings, which companies comprise Taiwan’s top 100 business groups in 2023? How has the ranking changed? This article, compiled by TEJ, provides an overview of the top 100 business groups, and offers insights into their development.
In 2023, the total asset and revenue scale of Taiwan’s top 100 business groups continued to grow compared to 2022. As shown in Figure 1, the total asset scale reached NT$151 trillion (the currency is NT$ throughout the article), marking a 3% increase from 2022. In terms of the core industry of the business groups, financial groups still held the largest share of assets, accounting for as much as 72%. The remaining 30% was evenly split between technology and traditional industry groups.
Figure 1, The Asset Sizes and YoY of Top 100 Taiwanese Business Groups. Unit: NT$1 billion, %
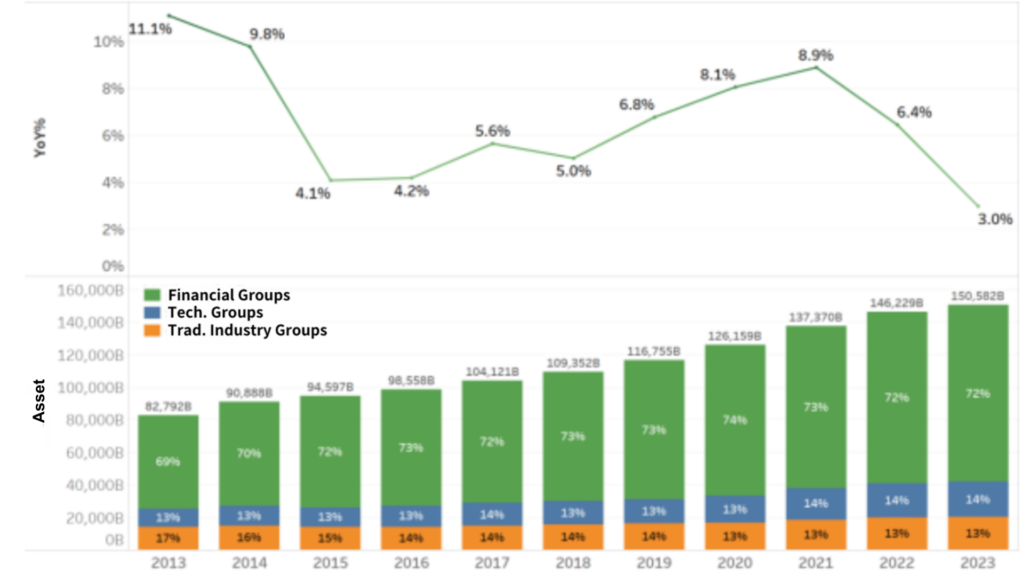
Source: TEJ Group Observer
As shown in Figure 2, the total revenue of Taiwan’s top 100 business groups in 2023 reached NT$34 trillion, representing an 8% decline. This drop was primarily attributed to high interest rates and inflation, the global economic slowdown, and the relatively high base period from the previous year. In terms of revenue composition, there was little change. Technology groups continued to account for 60% of the total revenue, while traditional industry and financial groups each maintained a share of approximately 20%.
Figure 2, The Revenue and YoY of Top 100 Taiwanese Business Groups Unit: NT$1 billion, %
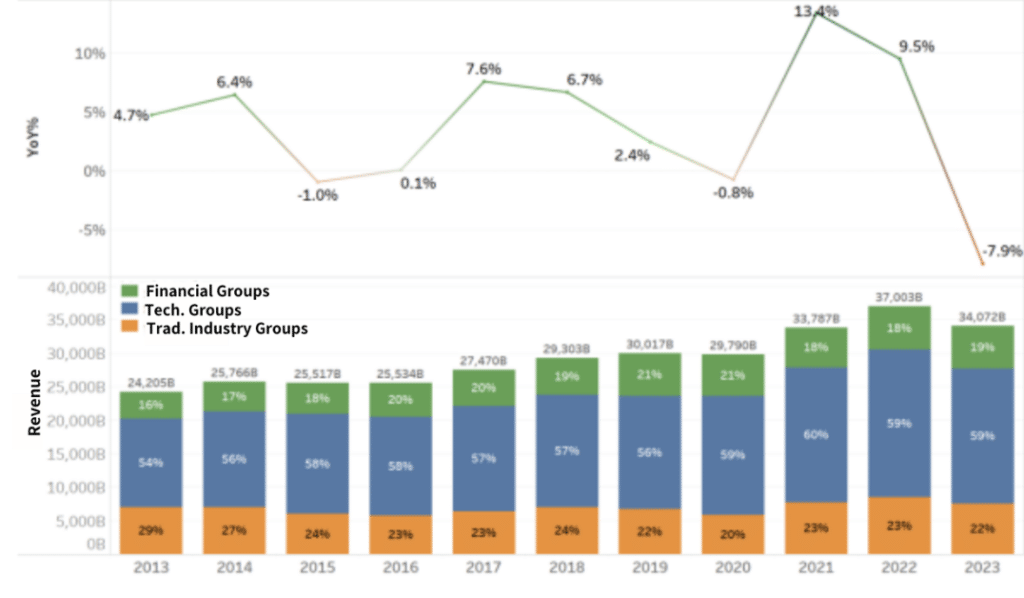
Source: TEJ Group Observer
Regarding profitability (as detailed in Figure 3), as previously mentioned, Taiwan’s business groups in 2023 were significantly impacted by high interest rates and inflation, leading to weakened end-user demand. Operating profit declined by 19% in 2022 and experienced a further sharp decline of 25% in 2023.
Figure 3, The Profit and YoY of Top 100 Taiwanese Business Groups Unit: NT$1 billion, %
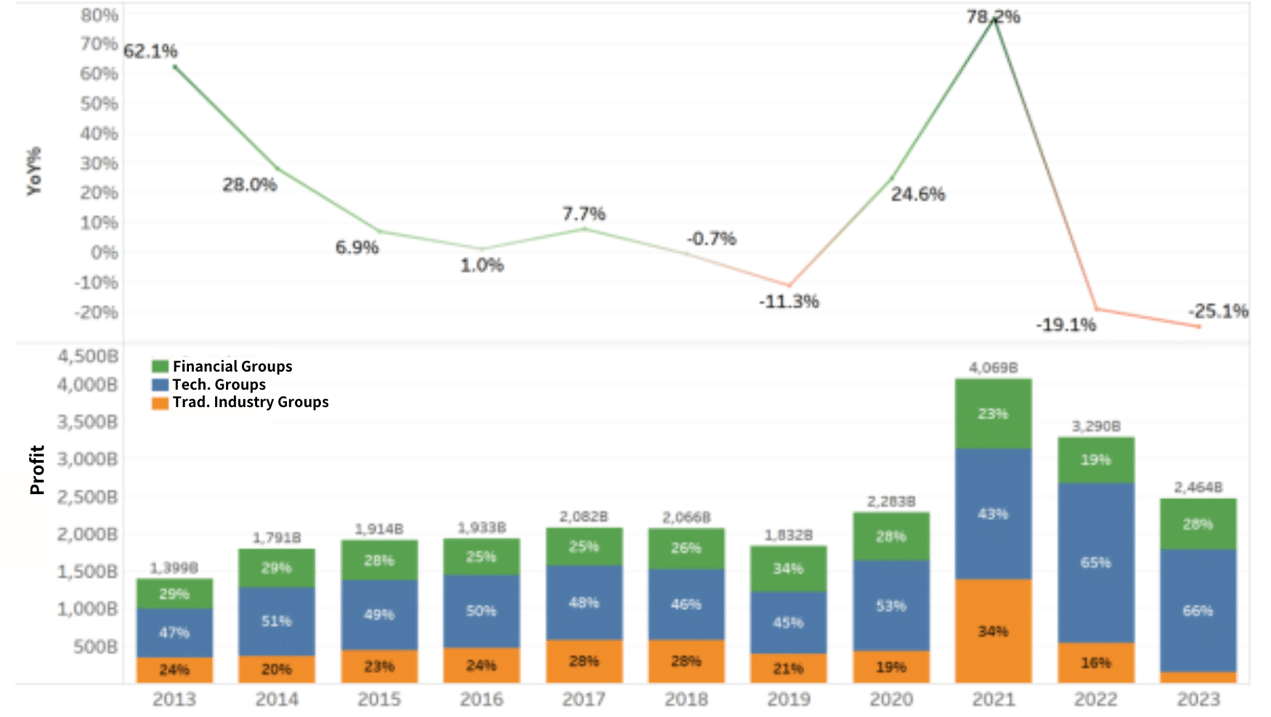
Source: TEJ Group Observer
For traditional industry groups, profit margins shrank significantly in 2023 due to a drop in raw material prices and shipping rates from their previous peaks. As a result, profits plunged by 70% compared to 2022 ( Figure 4).
Similarly, the technology sector faced a decline in profitability, impacted by weak demand for end-user products such as smartphones and PCs.
In contrast, financial groups experienced a recovery in profitability, benefiting from the appreciation of the U.S. dollar, which boosted the value of their dollar-denominated assets.
However, the growth in financial groups alone was insufficient to offset the declines in traditional and technology groups. Consequently, the overall profitability of the top 100 business groups fell, with total operating profit amounting to approximately NT$2.5 trillion, representing a 25% decline compared to 2022.
Figure 4, The Profit and YoY of Top Traditional Industry Groups Unit: NT$1 billion, %
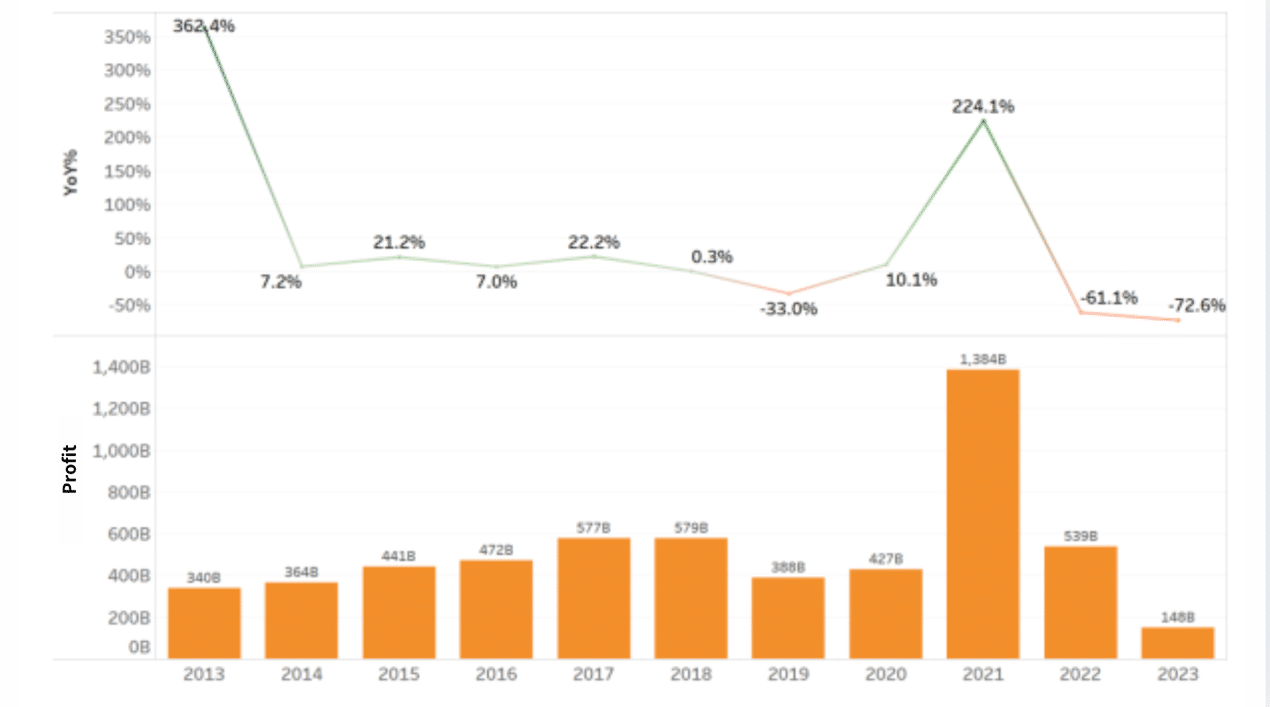
Source: TEJ Group Observer
There were notable changes in the profit share among the three sectors in 2023. Due to the continued significant decline in profitability of traditional industry groups for the second consecutive year, their profit share dropped from 16% in 2022 to just 6%. On the other hand, financial groups saw an increase in profitability, with their profit share rising to 28%. Although the technology sector also experienced a decline in profitability, the sharper decline in traditional industry groups resulted in the technology sector’s profit share increasing slightly from 64% to 66%. (As shown in Figure 5)
Figure 5, The Net Value and YoY of Top 100 Business Groups Unit: NT$1 billion, %
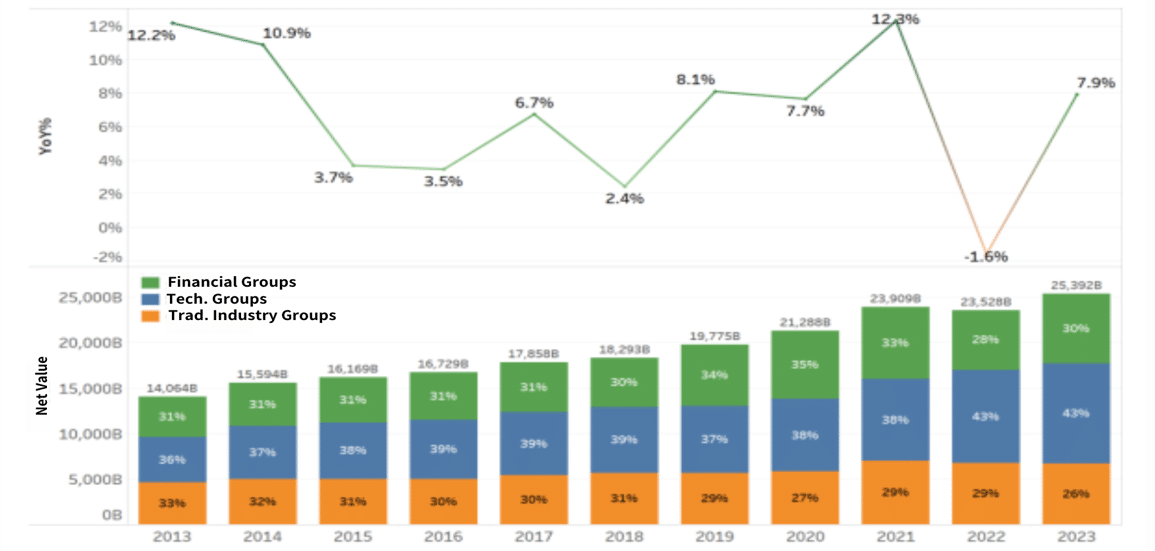
Source: TEJ Group Observer
Next, we examine the changes in rankings among the top 100 business groups. Based on the 2023 asset rankings of Taiwan’s business groups, financial groups accounted for the largest share, with 40 groups, followed by 34 traditional industry groups and 26 technology groups.
Among Taiwan’s top 100 business groups ranked by assets, the following experienced significant ranking changes compared to the previous year:
G1216 Uni-President Group: In 2023, Uni-President Group’s asset ranking rose by 10 positions to 35th place. The primary reason was its significant investment of NT$31.1 billion to acquire the remaining 60% equity of Carrefour from its French partner, fully integrating Carrefour as a consolidated entity. This acquisition increased the group’s asset size by nearly NT$60 billion. Additionally, the group’s subsidiary, 7-Eleven, expanded its store network in the Philippines. At the same time, Uni-President Securities benefited from a rising stock market, leading to a substantial increase in the market value of its financial assets. These factors contributed to the overall growth in Uni-President Group’s asset scale.
G2874 DBS Bank: In 2023, DBS Bank’s asset ranking rose by 9 positions to 27th place, primarily due to its acquisition of the retail banking division of G28792 Citibank Taiwan. This acquisition increased DBS Bank’s assets by 40%, reaching NT$1.1 trillion. On the other hand, Citibank Taiwan’s asset ranking fell by 20 positions to 51st after selling its consumer banking division.
G12844 Ting Hsin International Group: In 2023, the group’s asset ranking dropped by 9 positions to 77th place. This decline was primarily due to the merger of its subsidiary, Taiwan Star Telecom, with Taiwan Mobile under Fubon Group through a share swap, resulting in the loss of operational control and a subsequent contraction in asset size.
G1764 Chang Chun Petrochemical Group: In 2023, the group’s asset ranking fell by 13 positions to 91st place. This decline was due to a significant downturn in the petrochemical industry, leading to poor operational performance. Additionally, after achieving strong profits in 2022, the group distributed substantial cash dividends, resulting in a contraction of its asset size in 2023.
G2609 Yang Ming Marine Transport Group: Similar to the reasons affecting Chang Chun Petrochemical Group, Yang Ming Marine Transport Corporation’s asset ranking dropped by 10 positions, falling to 65th place.
G4938 Pegatron Group: In recent years, Pegatron has been adjusting its supply chain in coordination with its major client, Apple. This has involved gradually reducing or disposing of production capacity in China, leading to a contraction in asset size. As a result, its ranking dropped by 2 positions to 50th place.
G2382 Quanta Group: Similarly, as a major EMS (Electronics Manufacturing Services) provider, Quanta has been gradually reducing its production capacity in China and establishing factories in other regions to diversify its supply chain in response to customer demands. However, as the supply chain adjustments are ongoing, its asset size has decreased, resulting in a ranking drop of 6 positions to 41st place.
As previously mentioned, traditional industry groups performed poorly in 2023 due to the global economic downturn. The downturn was reflected in a significant decline in their operating profit rankings.
For instance, Taiwan’s largest petrochemical group, G1301 Formosa Plastics Group, faced weak downstream demand and a worsening supply glut caused by the continued capacity expansion of Chinese competitors. This led to a sharp decline in petrochemical product prices. The group’s total operating profit amounted to only NT$300 million, causing its ranking to plummet by 78 positions to 88th place—its worst operational performance in history. Moreover, as the imbalance between supply and demand is structural, the outlook remains bleak.
Similarly, G1328 CPC Corporation Taiwan also performed poorly, with an operating profit loss of NT$13.4 billion. However, due to a weaker performance baseline, its ranking rose slightly by 1 position to 98th place.
In addition to the petrochemical sector, other traditional industries also faced significant challenges in 2023. G1903 Shihlin Paper Corporation Group fell 89 positions to 96th place. G1605 Walsin Lihwa Group, engaged in stainless steel, wires and cables, and real estate, saw a sharp decline in operating profit, dropping 37 positions in the ranking to 56th place. G2002 China Steel Group fell 33 positions to 71st place. G1764 Chang Chun Group dropped 54 positions to 68th place. G1763 Chi Mei Group declined 27 positions to 93rd place. G2609 Yang Ming Marine Transport Group plunged 88 positions to 91st place.

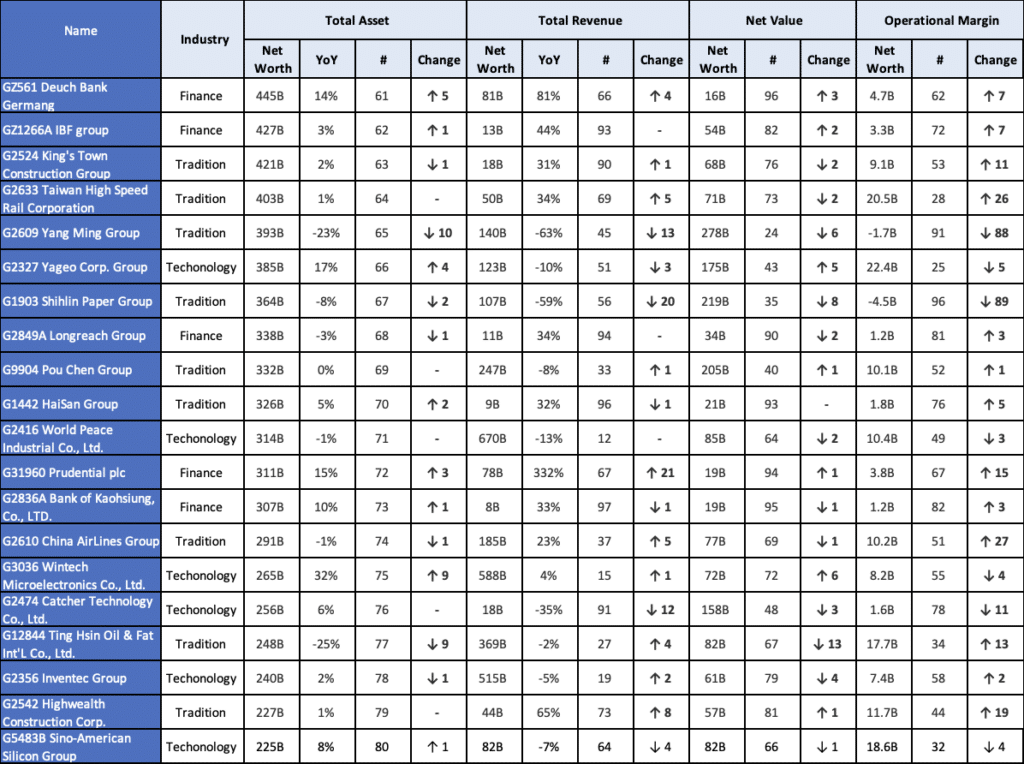
The following table shows the operating status of the top 100 groups in Taiwan:
Appendix 1. Ranking of the top 100 groups – ranked 1-20 according to asset size Unit: NT$1 billion, %
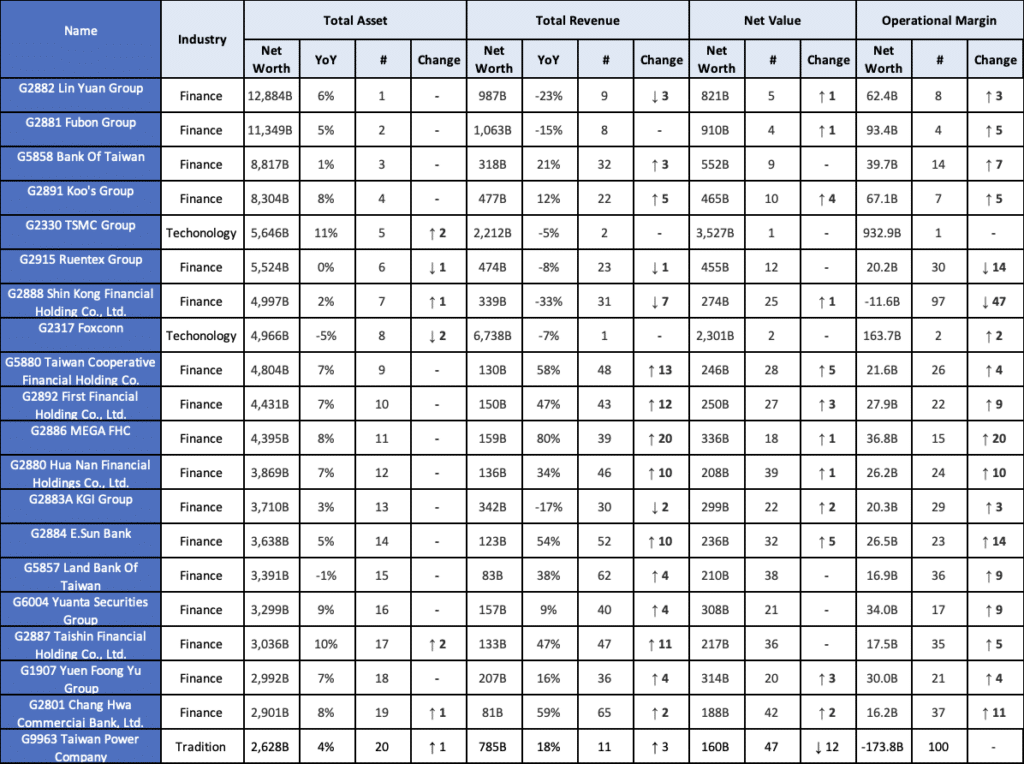
Source: TEJ Group Observer
Appendix 2. Ranking of the top 100 groups – ranked 21-40 according to asset size Unit: NT$1 billion, %
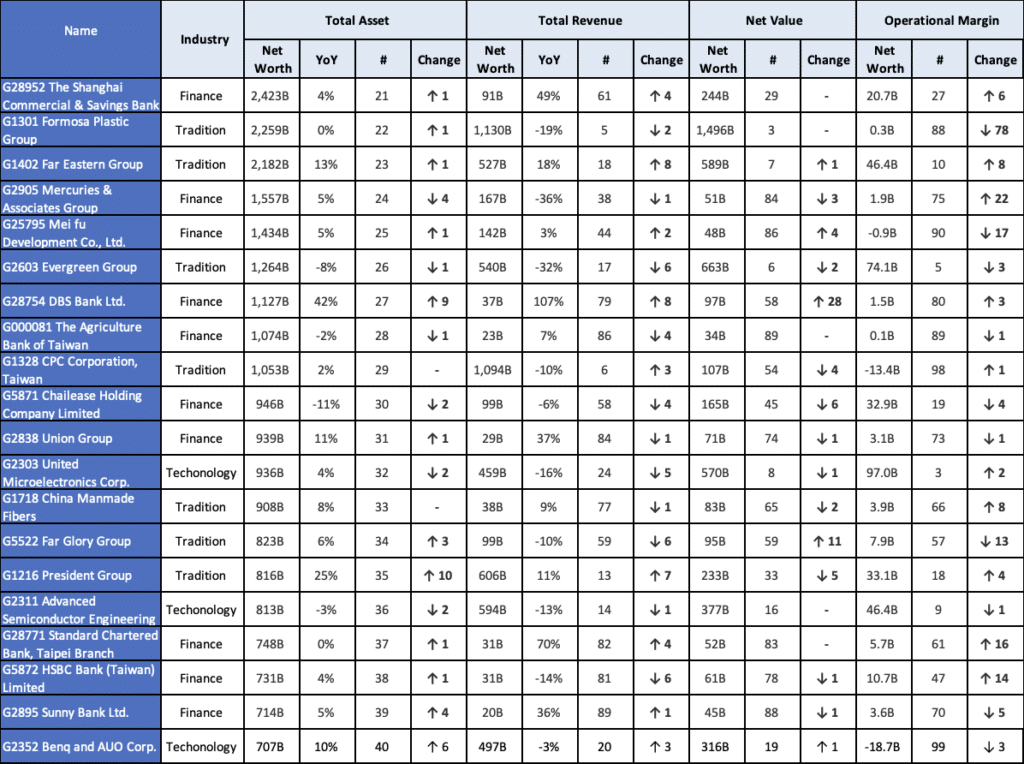
Source: TEJ Group Observer
Appendix 3. Ranking of the top 100 groups – ranked 41-60 according to asset size Unit: NT$1 billion, %
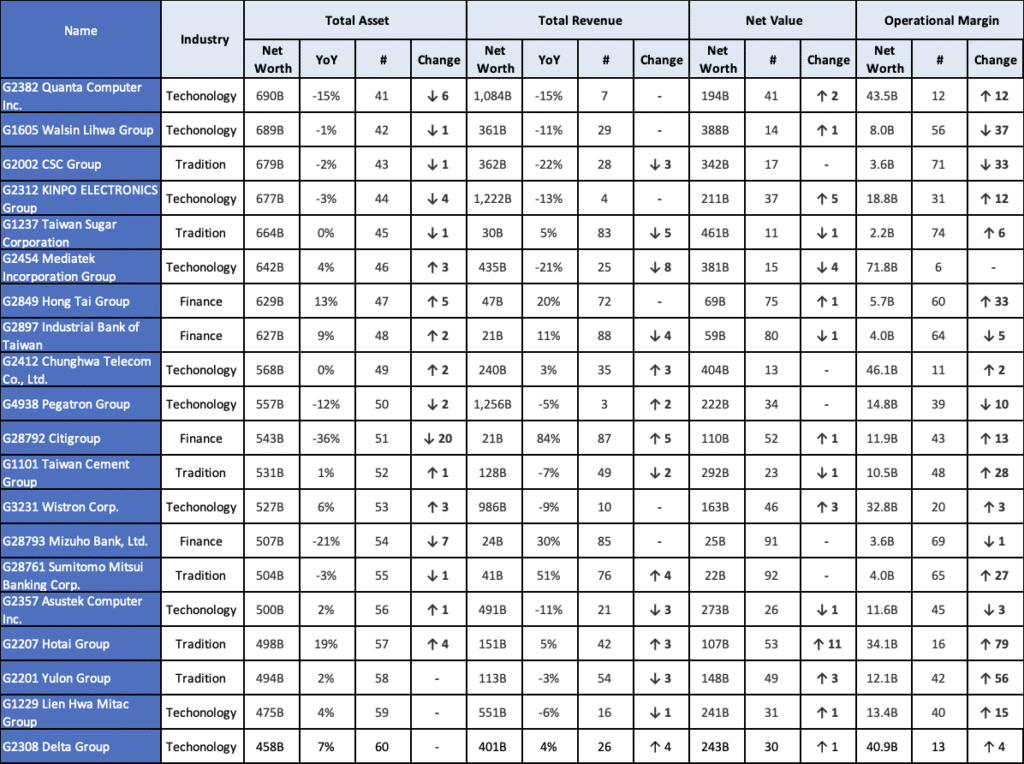
Source: TEJ Group Observer
Appendix 4. Ranking of the top 100 groups – ranked 61-80 according to asset size Unit: NT$1 billion, %
Source: TEJ Group Observer
Appendix 5. Ranking of the top 100 groups – ranked 81-100 according to asset size Unit: NT$1 billion, %
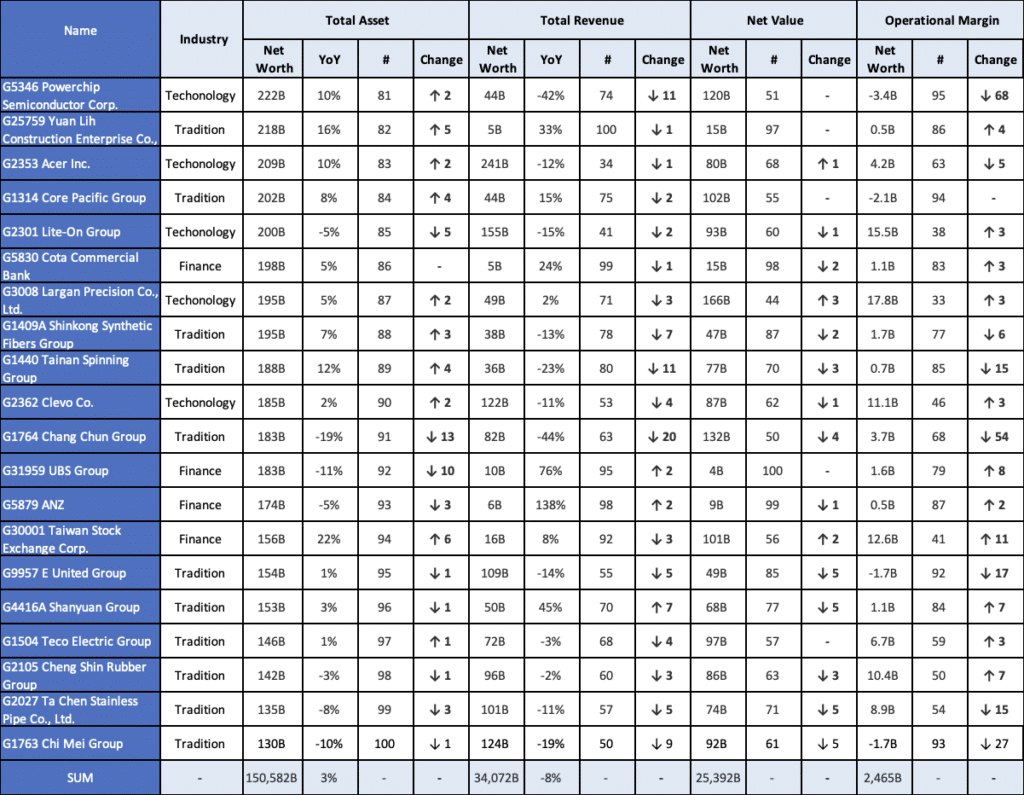
Source: TEJ Group Observer
This article highlights the current Top 100 Corporate Groups, including internationally renowned names such as TSMC Group, Foxconn Group, and UMC Group.Taiwan companies, particularly in the semiconductor and AI supply chain, play a pivotal role in driving global technological advancements. By leveraging TEJ’s comprehensive Taiwan database, which includes financial data and fundamental data, you can gain deep insights into the current state and growth trajectories of Taiwan’s industries. Learn more about TEJ’s Fundamental Data Solutions.
Additionally, with TEJ TCRI Watchdog (TCRI WD), critical events and announcements that impact corporate performance are systematically screened and evaluated. The tool assigns scores to indicate the intensity of these events on corporate credit risk, enabling a clearer understanding of the dynamics shaping Taiwan’s enterprises. Explore TCRI Watchdog for smarter insights.
Get the NEWs Detail of Taiwan Companies~
