
Photo from Pexels by Markus Spiske
Table of Contents
In financial markets, technical analysis has long been a crucial tool for investors to assess market trends and develop trading strategies. Among these techniques, the Ichimoku Kinko Hyo (Ichimoku Cloud) utilizes five moving averages and a cloud structure to analyze stock support, resistance, and trend changes, enabling traders to quickly identify bullish or bearish signals. However, traditional Ichimoku strategies rely on fixed parameters (9-26-52) and visual interpretation, making them inflexible in adapting to different market conditions. Additionally, in choppy market conditions, Ichimoku-based signals can generate false positives, leading to erroneous trades and capital drawdowns.
With the advancement of machine learning, XGBoost (Extreme Gradient Boosting) has become one of the most widely used models in quantitative trading. By leveraging Gradient Boosting Decision Trees (GBDT), XGBoost learns complex high-dimensional relationships between different data points and enhances the filtering and decision-making process of trading signals. Compared to purely relying on technical indicators, XGBoost can integrate various market variables—such as price momentum, volume changes, and market sentiment—to uncover relationships between data and future stock returns. This ultimately improves the accuracy and robustness of trading strategies.
Strategy Overview
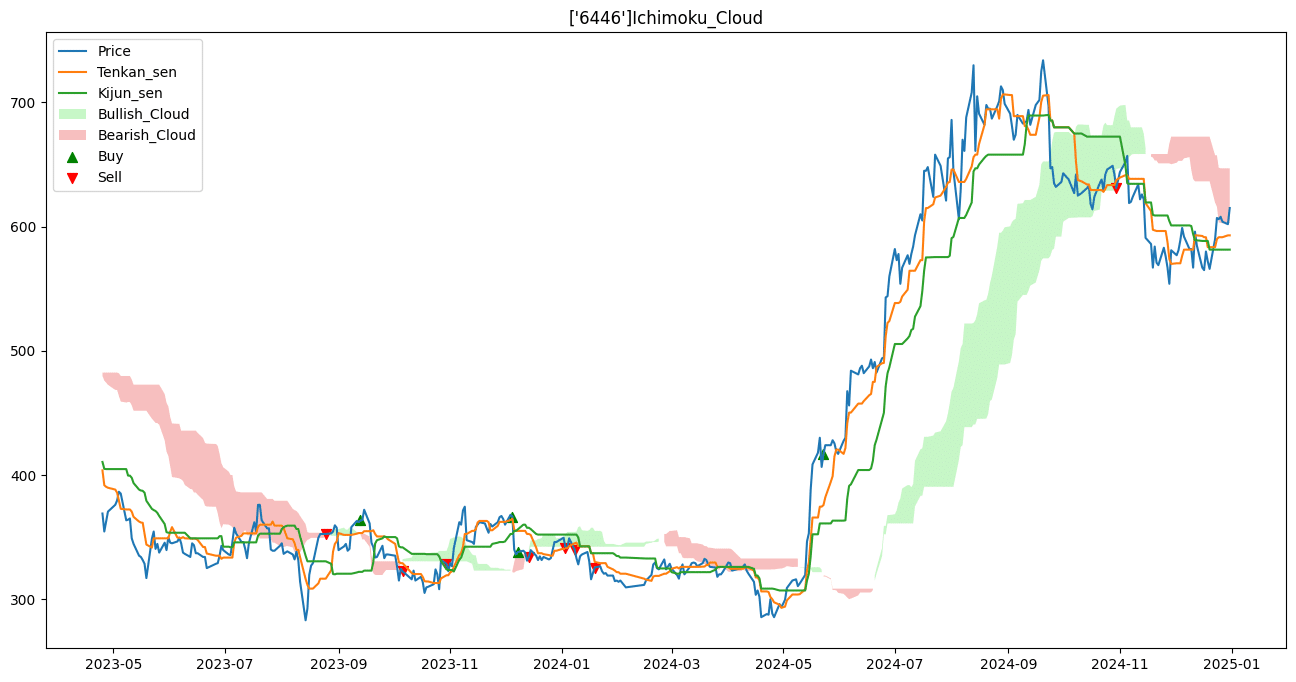
The Ichimoku Cloud was developed by Japanese journalist Goichi Hosoda as a comprehensive technical indicator that evaluates market trends through five key lines. By analyzing the shape and interactions of these lines, traders can make informed investment decisions. The five components of the Ichimoku Cloud are:
Together, these five components create a cloud-like structure that provides traders with a clear view of market trends, potential reversals, and key support or resistance zones. The relative position of the price and the cloud helps determine whether the market is in a bullish, bearish, or neutral phase.
Ichimoku Cloud Calculation Formula and Code Demonstration
The Ichimoku Cloud provides a trading signal interpretation method known as “Three Confirmations” :
Generally, when the price moves outside of a consolidation range, a valid Three Confirmations Bullish signal suggests a strong uptrend, while a Three Confirmations Bearish signal indicates a downtrend.
In this study, the traditional Three Confirmations Bullish signal is slightly adjusted to generate optimized buy signals for enhanced trading performance.
Three Confirmations Bullish – Buy Signal:
A bullish signal occurs when the following three conditions are met:
A bearish signal occurs when the following conditions are satisfied:
When a Three Confirmations Bullish signal appears, it is considered a buy signal based on the Ichimoku strategy. Conversely, a Three Confirmations Bearish signal is treated as a sell signal.
In this study, these signals will be combined with machine learning model outputs to generate optimized trading decisions.
For more details on the Ichimoku Cloud strategy, refer to: Click Here
XGBoost (eXtreme Gradient Boosting) is a machine learning algorithm based on Gradient Boosting Decision Trees (GBDT). It learns patterns in data by combining multiple weak Decision Trees, gradually improving their predictive accuracy to form a strong forecasting model. Due to its high efficiency, interpretability, and strong generalization ability, XGBoost is widely applied in financial markets and quantitative trading strategies.
In this study, we utilize Ichimoku Cloud data along with fundamental trading data such as open, high, low, close, and volume (OHLCV) to train the XGBoost model. The goal is to enable the model to learn effective trading signals and potentially enhance investment performance.
By training the XGBoost model on these signals, we aim to identify the hidden relationships between Ichimoku Cloud patterns and future price movements. The expectation is that the model will discover profitable trading opportunities, ultimately improving overall investment performance.
This study focuses on a single stock, 6446 , as the trading target. The strategy involves adjusting capital allocation dynamically based on entry and exit signals.
The objective is to outperform the buy-and-hold strategy by optimizing trading decisions through the Ichimoku Cloud and XGBoost model, aiming for better investment performance.
This study implements five trading strategies, each with a distinct logic:
Each strategy generates buy and sell signals based on either Ichimoku Cloud or XGBoost predictions, forming two sets of trading signals during backtesting.
General Strategy (Basic Ichimoku Kinko Hyo Strategy):
This strategy executes trades based on the Ichimoku Kinko Hyo technical indicator. Upon the first occurrence of a buy signal, 50% of the capital position is allocated (to prevent the cash level from remaining too low and to dilute the overall strategy return). Each subsequent buy signal increases the position by 20%, while each sell signal reduces the position by 20% (adjusting the position size based on subsequent signals). Additionally, leverage usage is restricted within the trading logic, with a leverage cap of 100%, ensuring that the strategy does not exceed the principal amount (no leverage is applied) and that short selling is not allowed.
This strategy executes trades based on the output of the XGBoost model. The position sizing logic follows the same rules as the general strategy (pure Ichimoku Kinko Hyo strategy).
Upon the first occurrence of a technical indicator buy signal, 50% of the capital position is allocated (to prevent the cash level from remaining too low and to dilute the overall strategy return). For subsequent trades, a dual-signal confirmation is required:
Similarly, leverage is not allowed, and short selling is prohibited in this strategy.
The position sizing logic is similar to the hybrid strategy based on technical indicators, except that the primary signal for decision-making is derived from the machine learning model instead.
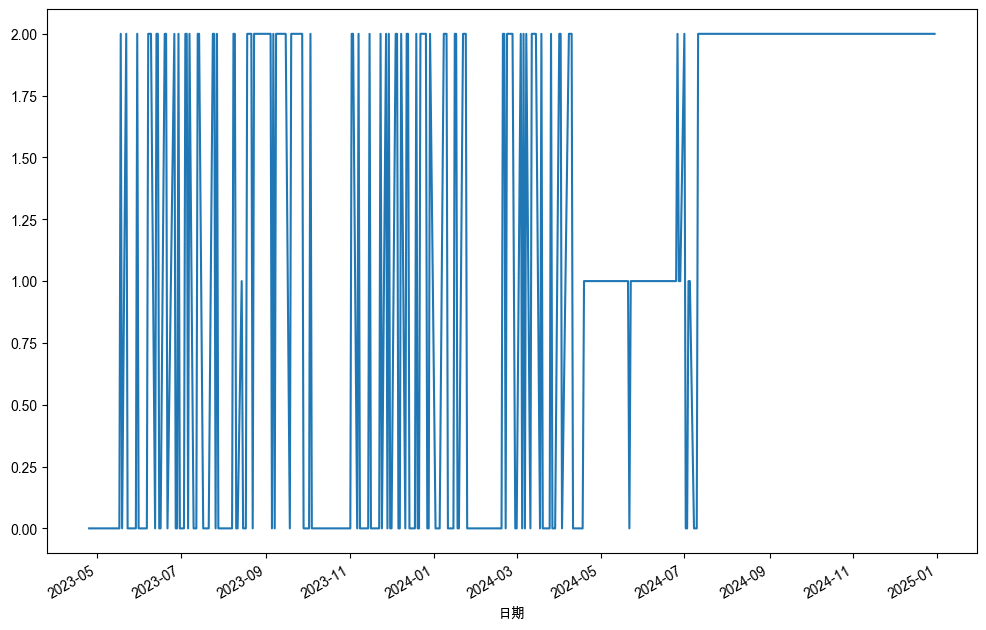
From the chart, it can be observed that the machine learning model’s signal generation tends to fluctuate frequently, leading to inconsistent signals. As a result, placing trades strictly based on the model’s signals may incur higher transaction costs. Additionally, it is noticeable that after September 2024, the predicted signals are consistently Sellsignals. This phenomenon will be further discussed in the following sections.
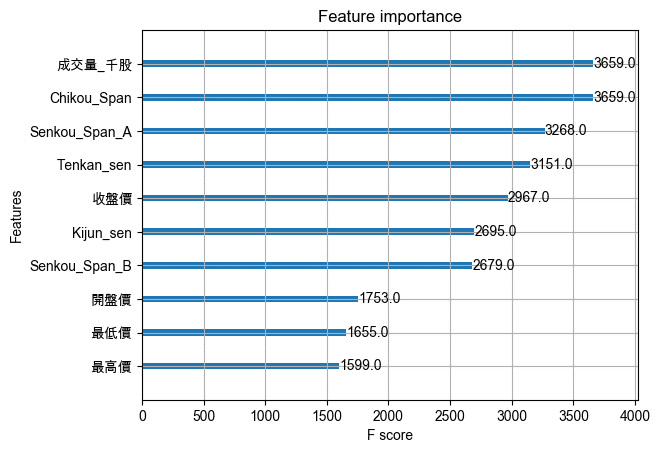
This chart represents the frequency of data features used during the training of the XGBoost model. Features that are used more frequently are considered more important. From the results, it can be observed that the top-ranked features are primarily technical indicators, indicating that incorporating these features, in addition to basic open-high-low-close-volume (OHLCV) data, enhances the model’s predictive performance.
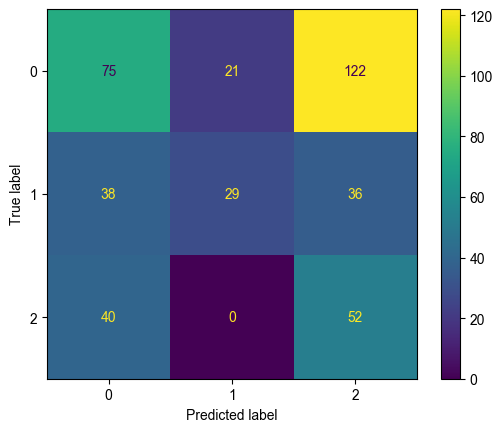
This chart represents the prediction confusion matrix for the XGBoost model, where:
The most important cells to analyze are:
These two cells indicate cases where the model’s predictions are completely opposite to the actual signals.
Starting with (1,2), this represents situations where the actual signal indicates a sell, but the model predicts a buy. The data shows that this scenario never occurred (0 times), suggesting that the model is less prone to this type of misclassification.
On the other hand, (2,1) represents cases where the actual signal indicates a buy, but the model predicts a sell. This occurred 36 times. However, since the trading strategy prohibits short selling, this misclassification only results in reducing positions or staying out of the market, rather than incurring actual losses due to shorting. Hence, while this prediction error might cause missed opportunities for gains, it does not directly lead to financial losses.
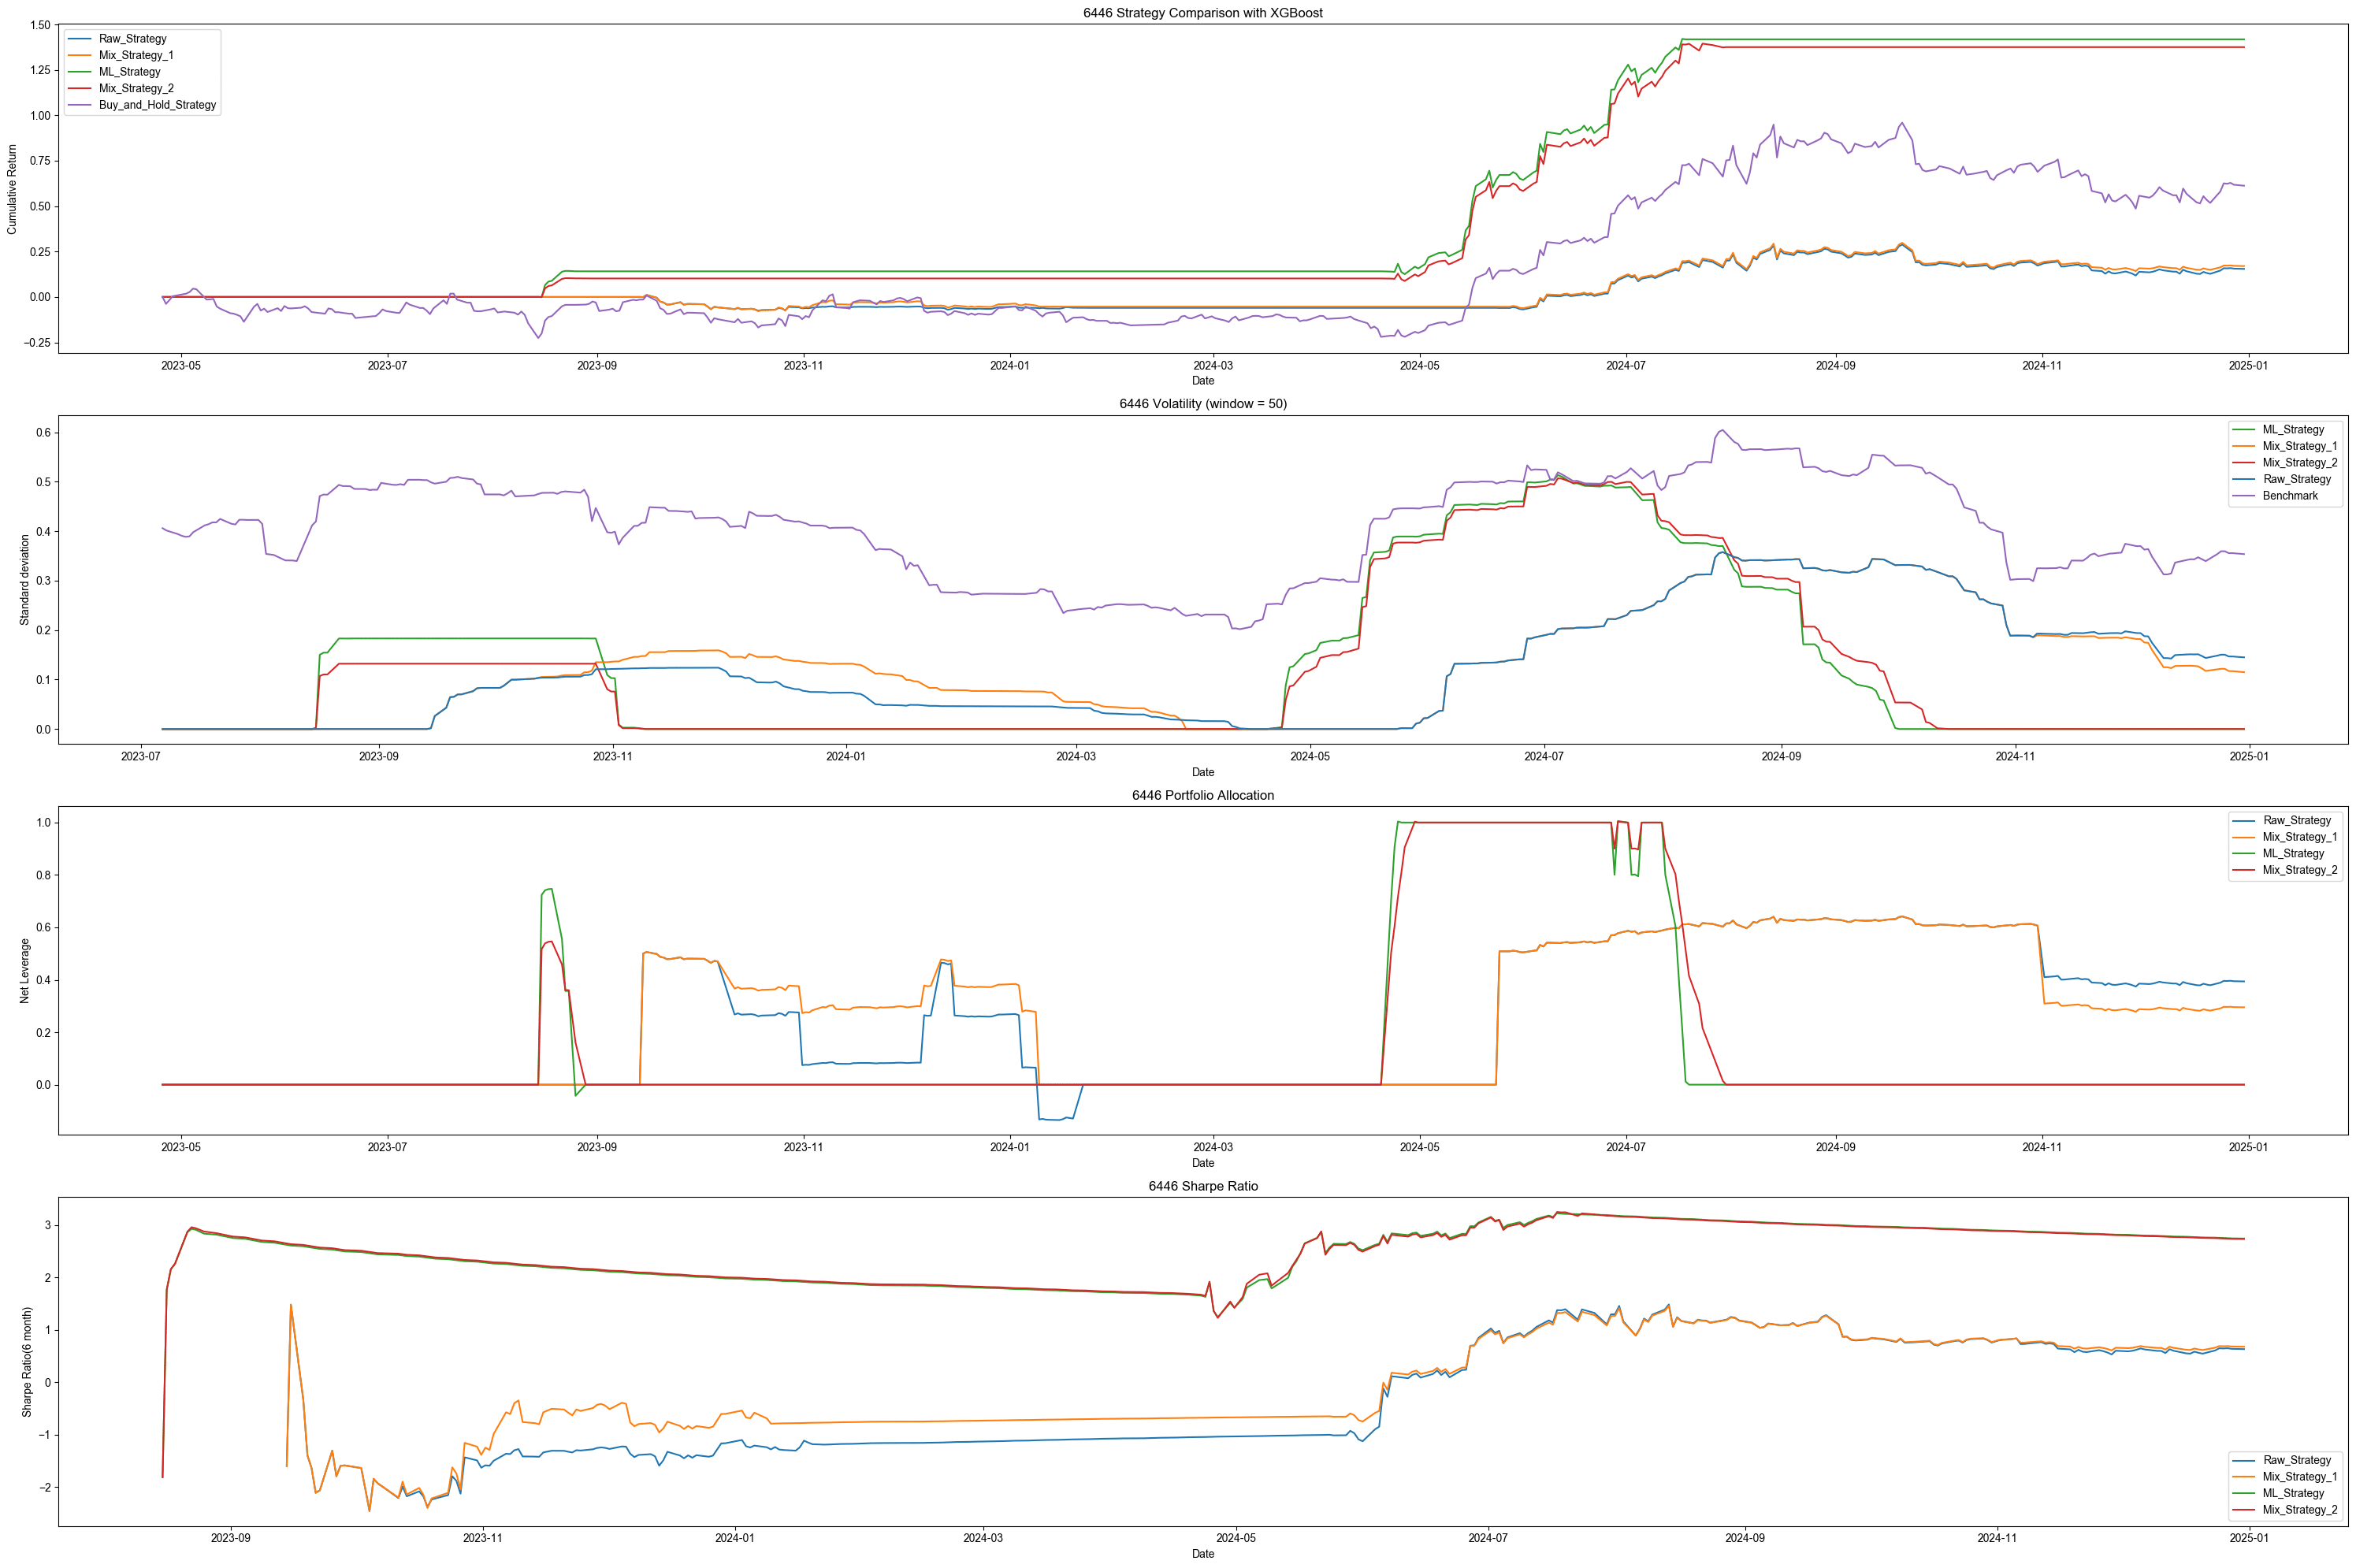
The first chart represents the cumulative return of different strategies. Looking at the final cumulative returns:
Examining the remaining strategies:
Next, we analyze the capital utilization rate. Since leverage restrictions were imposed in the trading conditions, none of the four strategies employed leverage.
Notably, during the stock’s uptrend from April 2024 to July 2024, the two machine learning-driven strategies built their positions earlier than the two technical indicator-driven strategies. This provides evidence that the machine learning algorithm was able to anticipate future price increases earlier, reinforcing the credibility of its predictive capability and the effectiveness of the strategy.
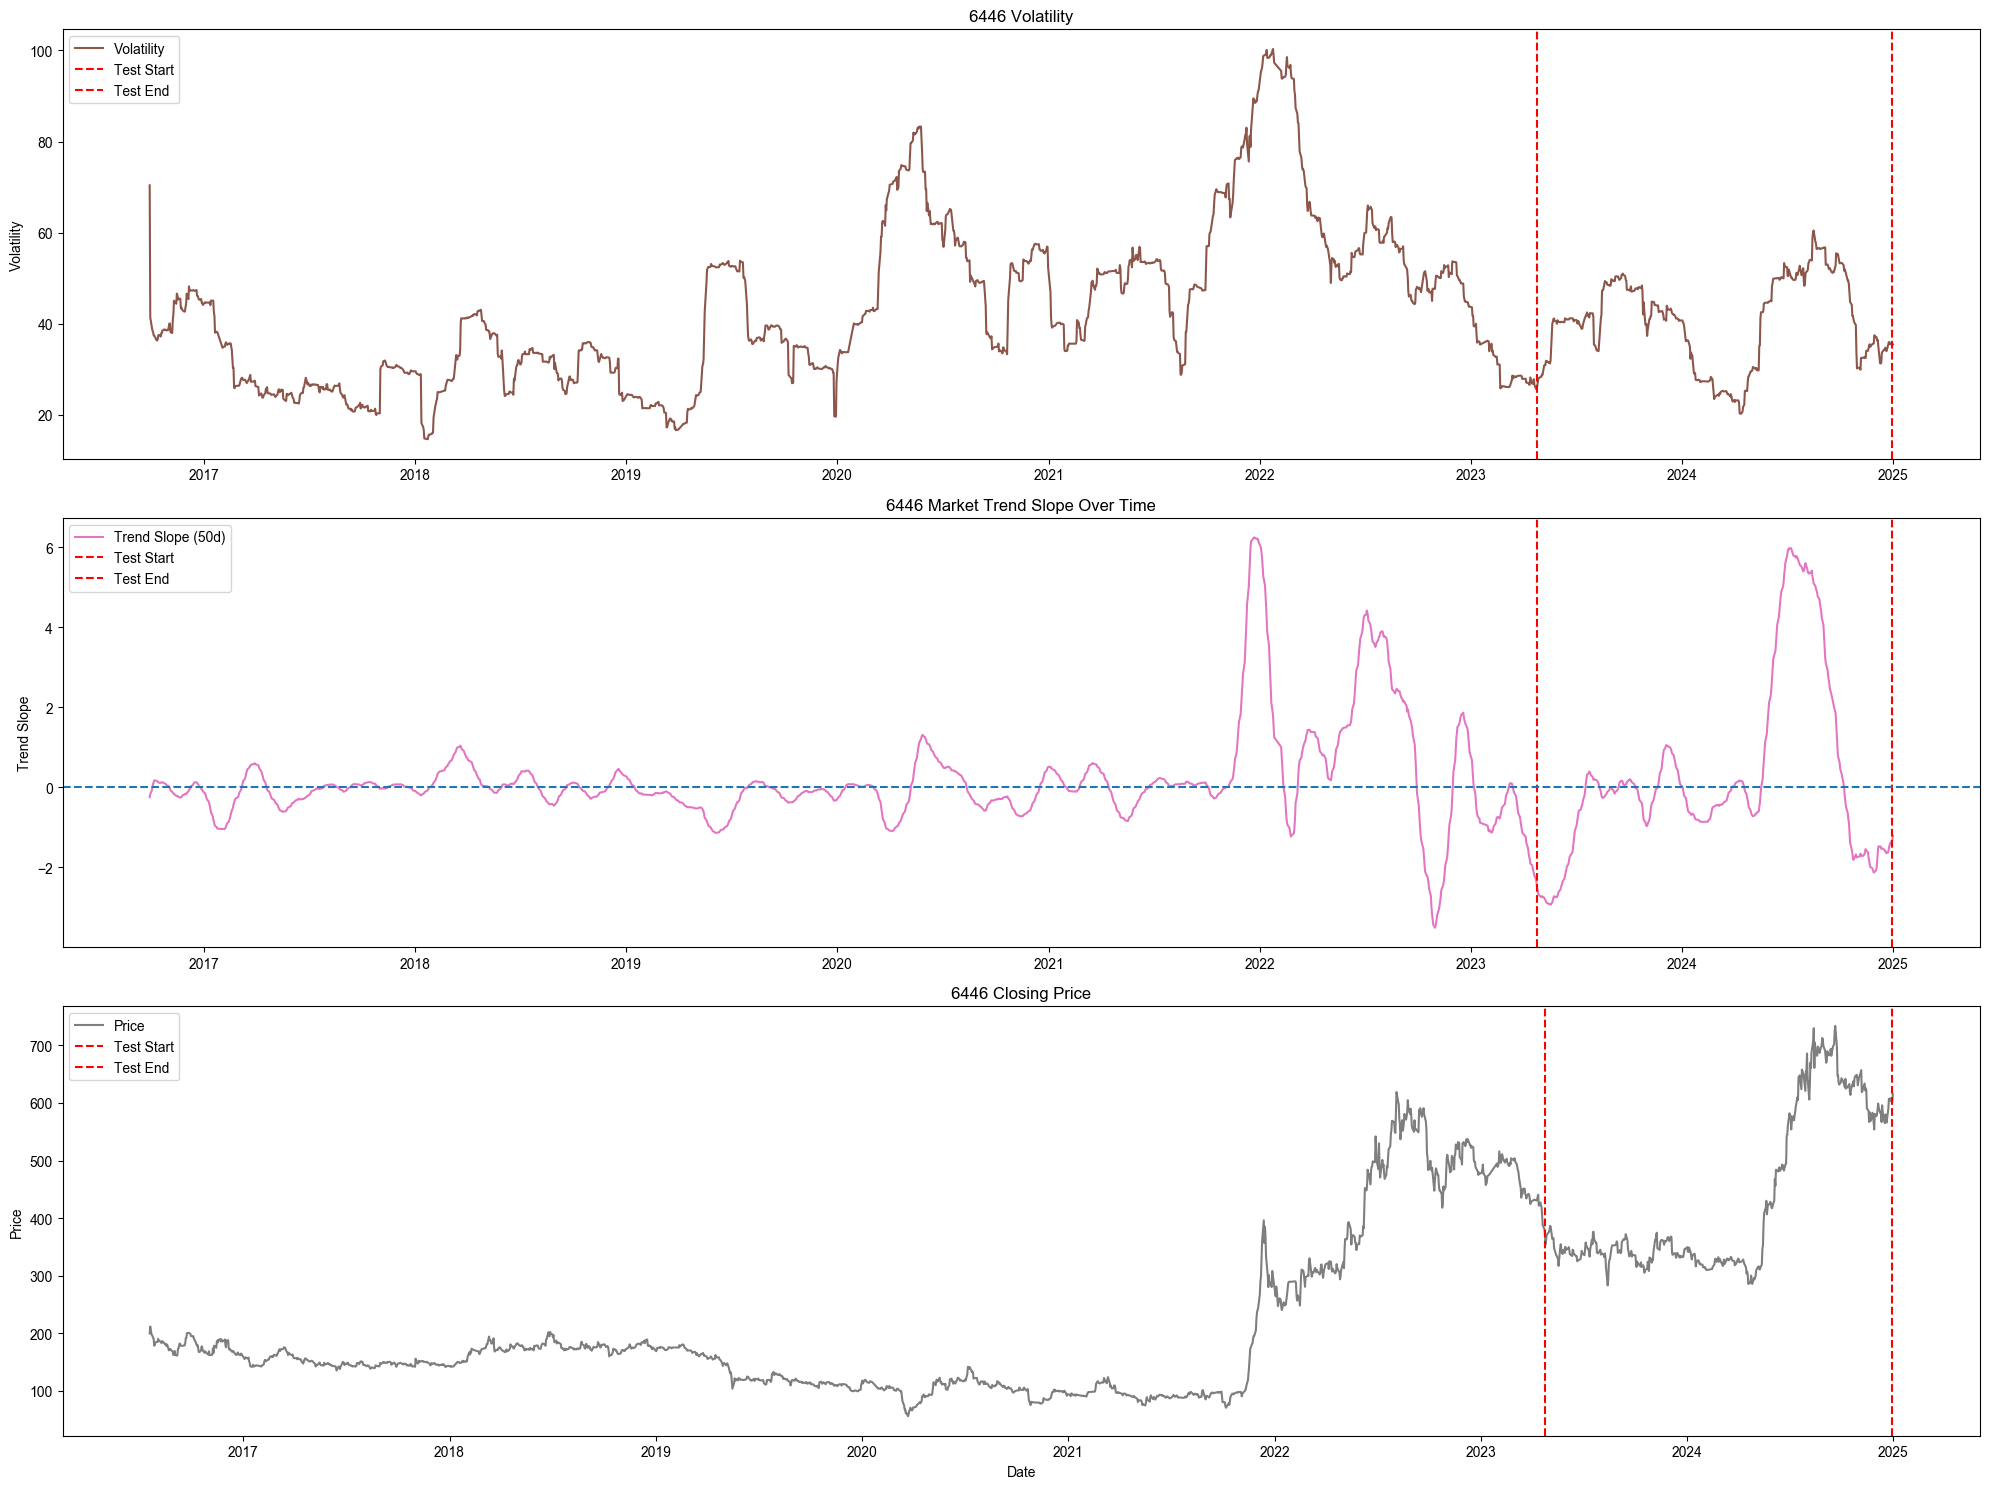
This chart represents the trading data for stock 6446, covering both the backtesting period and the model training period.
This explains why, in the previous signal chart, the model continuously generated sell signals at the end of the test set—the model had never encountered such price levels before. This highlights a key limitation of relying solely on machine learning models for signal generation, as they may struggle in unseen market conditions.
Therefore, it is recommended to combine technical indicators or other analytical methods to form a more comprehensive strategy for trade execution.
This study evaluates the effectiveness of trading strategies using only a single stock. However, whether similar results hold across other stocks or industries requires further analysis and research.
Additionally, when the stock price in the test set surpasses its historical high, it may indicate that the current model is no longer suitable for making predictions. A potential improvement for future research could be designing alert thresholds that signal when the price level has exceeded the model’s applicable range. Once the threshold is triggered, adjustments to the model or trading strategy logic may be necessary to reduce investment risk.
For future research, readers may consider training the model with a broader set of features, such as incorporating different types of data attributes (volatility, 50-day moving average trend slope, and other technical indicators). These additional features could help the model capture higher-dimensional price patterns and variations, potentially improving predictive performance.
Important Reminder: This analysis is for reference only and does not constitute any product or investment advice.
We welcome readers interested in various trading strategies to consider purchasing relevant solutions from Quantitative Finance Solution. With our high-quality databases, you can construct a trading strategy that suits your needs.
“Taiwan stock market data, TEJ collect it all
The characteristics of the Taiwan stock market differ from those of other European and American markets. Especially in the first quarter of 2024, with the Taiwan Stock Exchange reaching a new high of 20,000 points due to the rise in TSMC’s stock price, global institutional investors are paying more attention to the performance of the Taiwan stock market.
Taiwan Economical Journal (TEJ), a financial database established in Taiwan for over 30 years, serves local financial institutions and academic institutions, and has long-term cooperation with internationally renowned data providers, providing high-quality financial data for five financial markets in Asia.
With TEJ’s assistance, you can access relevant information about major stock markets in Asia, such as securities market, financials data, enterprise operations, board of directors, sustainability data, etc., providing investors with timely and high-quality content. Additionally, TEJ offers advisory services to help solve problems in theoretical practice and financial management!
TQuant Lab Ichimoku Kinko Hyo Strategy, A Self-contained Technical Analysis Indicator
Michael Sivy’s 4 Key Income Investing Principles Unveiled
