
Table of Contents
Short selling is often regarded as a channel through which “smart money” conveys negative private information. Yet in Taiwan’s stock market, the information contained in short-selling activity is far from straightforward. This is largely due to the market’s unique dual-track mechanism: retail investors primarily short stocks through margin shorting, while institutional investors—especially foreign institutions—utilize securities borrowing and lending (SBL). The coexistence of these two structurally different channels introduces considerable noise into the signal.
This study aims to isolate and highlight the component of short-selling behavior that truly reflects informed trading. Specifically, we focus on SBL short sales, a segment dominated by institutional investors, and construct a factor that more cleanly captures the sentiment embedded in informed short-selling—namely, the Short Interest Ratio (SIR). Using Taiwan as the empirical setting, we examine the factor’s cross-sectional return predictability, explore its interaction with firm size, and ultimately evaluate its practical value in strengthening portfolio robustness through factor-based strategy backtesting.
➡️ Dive into the Factor Library for deeper research insights!
Taiwan’s short-selling framework is shaped by two distinct mechanisms: margin short selling, predominantly used by retail investors, and SBL short selling, a channel for institutional investors, including foreign institutions. These two systems represent fundamentally different trader profiles, leading to very different informational interpretations behind their short-selling activities.
Local academic research provides strong evidence supporting this distinction. Studies by Lee et al. (2017) and Ting et al. (2018) reach highly consistent conclusions: retail-driven margin short selling behaves more like noise trading, and high margin short balances often precede positive future returns due to subsequent price reversals. In contrast, short selling conducted through the institutional SBL channel reliably predicts negative future returns, indicating that it is institutional short sellers—not retail traders—who act as informed participants in the market.
Building on this foundation, our core hypothesis is straightforward: in Taiwan’s market, only institutional short-selling activity captures the true negative information implied by smart money. Accordingly, to construct a factor that accurately reflects the expectations of informed traders, we focus exclusively on SBL short-sale balances as the basis for measuring short-selling sentiment.
This section outlines the construction of the Short Interest Ratio (SIR) factor and the portfolio-sorting framework used to evaluate its predictive ability. We adopt portfolio sorting as the primary empirical approach and assess whether SIR delivers stable and economically meaningful cross-sectional return predictability—abstracting from transaction costs at this stage. Our analysis proceeds through three perspectives:
Together, these components allow us to examine the SIR factor from both distributional and performance-based angles, setting the foundation for later strategy construction and backtesting.
This study uses data obtained entirely from Taiwan Economic Journal (TEJ) database, include:
Following the findings of prior Taiwan-focused research, we construct the Short Interest Ratio (SIR) by concentrating exclusively on SBL short-sale balances, which are dominated by institutional investors. This choice is intentional: unlike retail-driven margin shorting—which frequently reflects noise trading—SBL activity captures the behavior of informed traders and therefore conveys more meaningful negative sentiment.
Consistent with international literature such as Boehmer et al. (2008), we define the Short Interest Ratio (SIR) as :

To understand how the SIR factor is distributed across Taiwan’s equity market, we begin with a detailed descriptive analysis. A notable characteristic of the dataset is the large number of stocks with zero SBL short-sale activity (SIR = 0). Using a conventional equal-sized portfolio sort would mix these zero observations with marginally positive values, obscuring the informative variation in short-selling intensity.
To address this, we employ a modified sorting procedure. On each trading day, stocks are grouped as follows:
This approach yields five portfolios in total. P1 represents the “no-shorting” group, while P2 through P5 capture progressively higher levels of short-selling pressure.
Table 1 summarizes the descriptive statistics for each portfolio over the full sample period. One standout finding is that P1 accounts for 25.56% of all observations, implying that roughly one-quarter of listed companies are not subject to institutional short-selling at any given time.
| Portfolio | Min | Max | Mean | Std | Count | % |
|---|---|---|---|---|---|---|
| 1 | 0.00000 | 0.00000 | 0.00000 | 0.00000 | 1302663 | 25.56% |
| 2 | 0.00001 | 0.00143 | 0.00060 | 0.00042 | 950185 | 18.65% |
| 3 | 0.00144 | 0.00447 | 0.00276 | 0.00086 | 946740 | 18.58% |
| 4 | 0.00448 | 0.01239 | 0.00774 | 0.00226 | 948538 | 18.61% |
| 5 | 0.01240 | 0.10665 | 0.02706 | 0.01516 | 947694 | 18.60% |
Data Period: Jan 2013 – Jul 2025
This section examines whether the Short Interest Ratio (SIR) contains predictive power for future stock returns. Our analysis focuses on two elements:
(1) the return spread between the extreme SIR portfolios—P1 (no shorting) and P5 (highest short-selling pressure), and
(2) the performance of a long–short strategy constructed from these two portfolios.
Table 2 reports the average daily returns for P1, P5, and the long–short spread (P5 − P1) across various holding horizons (1-day, 5-day, 10-day, and 21-day). The results align closely with the core hypothesis of this study. Across all holding periods, P1 consistently outperforms P5 by a substantial margin, indicating that stocks with heavier short-selling pressure tend to deliver significantly lower subsequent returns.
| Holding Period | 1-day | 5-day | 10-day | 21-day |
| High SIR (P5) | 2.741 | 2.923 | 2.974 | 3.017 |
| Zero SIR (P1) | 5.968 | 6.445 | 6.418 | 6.462 |
| Spread( P5-P1) | -3.227 | -4.033 | -3.974 | -3.924 |
Unit:bps Data Period: Jan 2013 – Jul 2025
➡️ Unlock more factor insights — starting with CGO
The figure 1 provides a clear visual representation of how average returns vary across the SIR portfolios. A distinctly monotonic pattern emerges: returns decline steadily from P1 to P5 across all holding horizons. This consistent downward slope reinforces the negative relationship between SIR and future returns—stocks facing stronger short-selling pressure reliably underperform those with no observable short interest.
Figure 1.: Average Returns Across SIR Quintile Portfolios
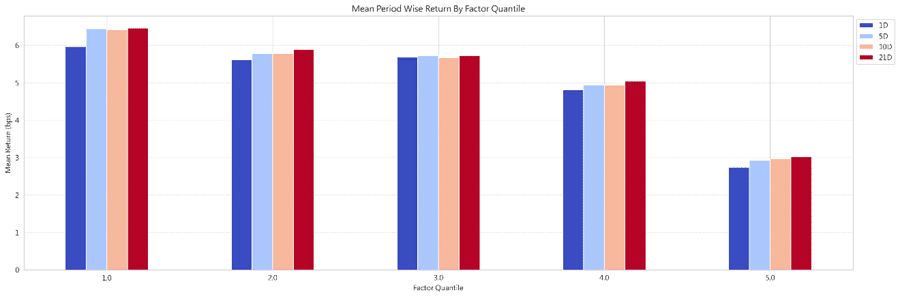
(This figure compares the average future returns of the five SIR-sorted portfolios across different holding periods. . Unit:bps Data Period: Jan 2013 – Jul 2025.)
To visualize the long-term performance of the SIR factor, Figure 2 plots the cumulative returns of the highest-SIR portfolio (P5) and the zero-SIR portfolio (P1).
As shown in the figure 2, the zero-SIR portfolio (P1)—representing stocks with no observable short-selling pressure—delivers a steadily rising cumulative return throughout the sample period. In contrast, the high-SIR portfolio (P5) lags persistently behind, with the performance gap between the two portfolios widening steadily over time. The cumulative return profile therefore offers clear and compelling evidence that SIR functions as a stable, long-lasting sentiment signal in Taiwan’s equity market.
Figure 2.Cumulative Returns of SIR Portfolios (P1 vs. P5)
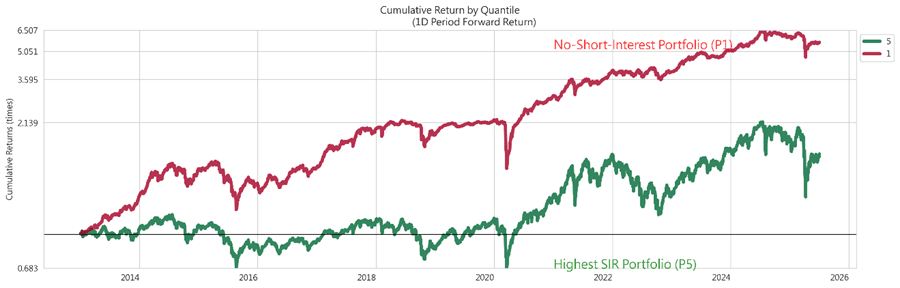
Holding period: 1D Data Period: Jan 2013 – Jul 2025
This section evaluates the predictive power of the SIR factor using the Information Coefficient (IC). We calculate the daily Spearman rank correlation between SIR values and future returns across multiple holding periods. The IC provides a direct measure of how well the cross-sectional ranking of SIR aligns with the cross-sectional ranking of subsequent performance.
Table 3. Summary Statistics of Information Coefficients (IC) Across Holding Periods
| Holding Period | 1-day | 5-day | 10-day | 21-day |
| IC Mean | 0.0005 | 0.0046 | 0.0017 | -0.0068 |
| IC Std | 0.1437 | 0.1479 | 0.1422 | 0.1345 |
| Risk Adjusted IC | 0.0036 | 0.0311 | 0.0119 | -0.0506 |
| IC < 0(%) | 0.4946 | 0.4792 | 0.4834 | 0.5267 |
| IC < 0.03(%) | 0.3972 | 0.39 | 0.3969 | 0.4271 |
| IC < 0.05(%) | 0.3396 | 0.3382 | 0.3461 | 0.3661 |
| IC t-value | 0.1998 | 1.7205 | 0.6591 | -2.7969 |
| IC p-value | 0.8416 | 0.0855* | 0.5099 | 0.0052*** |
| IC Skewness | -0.1195 | -0.1391 | -0.1112 | 0.0799 |
| IC Kurtosis | 0.1331 | 0.005 | -0.059 | 0.3288 |
Data Period: Jan 2013 – Jul 2025. Significance levels: *** p<0.01, ** p<0.05, * p<0.1.
Table 3 summarizes the IC statistics for the entire market. Interestingly, the results present a markedly different picture from the return spread analysis. Across the 1-day to 10-day horizons, the average ICs are relatively small—and in some cases even positive—suggesting weak or unstable monotonic relationships between SIR and future returns at the full-market level.
This observation does not imply that the SIR factor is ineffective. Rather, it indicates that the factor’s predictive signal may not manifest uniformly across all stocks, and its effect may be masked by heterogeneous dynamics among different market segments.
Indeed, the distribution of IC values hints at this underlying complexity: although institutional short-selling is expected to predict negative returns, its impact appears uneven when evaluated across the full universe of stocks.
To further investigate the instability observed in the market-wide IC results, we conduct a size-segmented analysis. At the end of each month, all stocks are sorted into five equal-sized groups based on market capitalization. We then compute the IC within each size group separately. The results are presented in Figure 3.
Figure 3.Average IC of SIR by Market Capitalization Groups
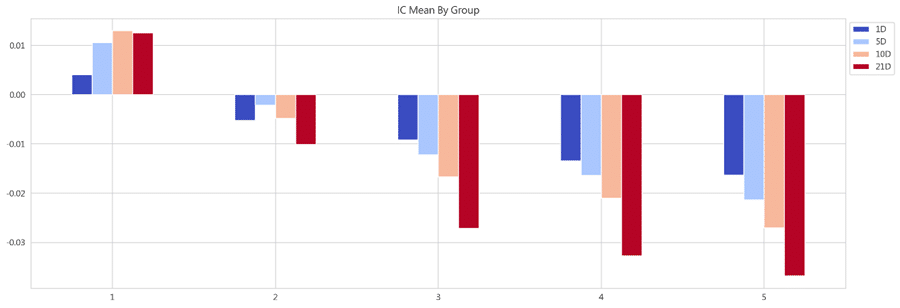
Stocks are evenly divided into five groups by daily market capitalization (1 = smallest, 5 = largest). The figure shows the average IC between SIR and future returns for each group across different holding periods; Sample period: Jan 2013 – Jul 2025
Figure 3 reveals a striking and intuitive pattern:
These opposing forces explain why the aggregate IC appears weak and unstable. The negative ICs from mid- and large-cap stocks are counteracted by the positive ICs from small-cap stocks, resulting in near-zero averages at the full-market level.
In summary, the predictive power of SIR is highly size-dependent. It behaves as a meaningful negative sentiment factor only among medium- and large-sized firms, while exhibiting an inverted effect among small caps.
Our findings uncover a distinctive structure behind the Short Interest Ratio (SIR) in Taiwan’s market. While the return spreads across SIR portfolios clearly show that institutional short-selling contains meaningful negative information, the market-wide IC results reveal that this signal is far from uniform. SIR is strongly predictive among mid- and large-cap stocks, yet reverses among small caps, where speculative dynamics and short-squeeze risks often dominate. This interplay explains why SIR appears weak on a broad market basis, despite its strong performance within the segments where informed trading truly occurs.
In other words, SIR is not a universal sentiment factor—but when applied to the right part of the market, it becomes a powerful indicator of institutional expectations.
With these insights established, the next question is straightforward: Can SIR improve real investment strategies?
In Part 2, we test how SIR interacts with established factors such as 52-week high momentum, how it performs under realistic transaction costs, and whether filtering out short-selling pressure can materially enhance portfolio returns.
➡️ Click to continue to Part 2 and see how SIR performs in live strategy backtests.
