
Table of Contents
TCRI Watchdog (WD) converts complex news and announcements into standardized quantitative alternative data. Building on our research into “Official Announcements (Source P)” and “Media News (Source N),” we have confirmed that disclosure channels directly dictate the speed and structure of market digestion.
This chapter moves from macro “Event Categories” to micro “Source × Sub-category” dimensions to capture actionable Alpha within granular events. Focusing on high-sensitivity “Corporate Control Events,” we analyze the signal heterogeneity between Source P and Source N. We further demonstrate how these high-precision signals assist investors in optimizing entry timing and hedging strategies.
This study adopts a standard event study methodology to evaluate abnormal returns (AR) and cumulative abnormal returns (CAAR) surrounding event occurrences.
| Group | Event Score |
|---|---|
| negative | <0 |
| -1 | =-1 |
| -2 | =-2 |
| -3 | =-3 |
| positive | >0 |
| 1 | =1 |
| 2 | =2 |
| 3 | =3 |
| neutral | =0 |
The post-event window is extended to +30 days to better capture signal persistence and tradability.
Compared to the previous chapter’s aggregate analysis at the category level, this section further decomposes events into specific subcategories to identify how different information sources and event types affect market reactions.
The analytical approach is adaptive:
Based on this framework, 2 representative event groups are examined across governance, fundamentals, and capital structure dimensions.
P-MO events originate from material disclosures (P), including ownership changes, control transfers, and governance disputes.
These disclosures are released via the MOPS system, including both mandatory regulatory filings and exchange- or firm-initiated announcements, characterized by high standardization and rapid information transmission.
Based on this principle, this study focuses on four representative event combinations across three major dimensions—corporate governance, fundamentals, and capital structure—to analyze their individual impacts on stock price performance.
This group consists of seven subcategories:
| Subcategory | Description |
|---|---|
| MO01 | Insider / major shareholder share transfers |
| MO02 | Waiver of subscription rights |
| MO03 | Insufficient insider shareholding |
| MO04 | External intervention / control disputes |
| MO05 | Control transfer |
| MO06 | Share pledging |
| MO07 | Financial distress of insiders / major shareholders |
Figure 1 presents the distribution of event scores. A total of 849 events are observed:
Figure 1:Event Sample Distribution (P-MO)
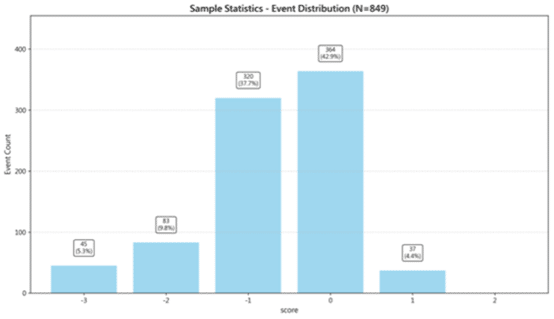
Table 2:Detailed Statistical Results (P-MO)
| Group | Event Count | Mean AAR (%) | Final CAAR (%) |
|---|---|---|---|
| 1 | 37 | 0.50 | +19.05*** |
| positive | 37 | 0.50 | +19.05*** |
| neutral | 364 | 0.12 | +4.64*** |
| negative | 448 | −0.06 | −2.41** |
| −1 | 320 | −0.10 | −4.03*** |
| −2 | 83 | 0.03 | +1.27 |
| −3 | 45 | 0.03 | +1.16 |
CAAR patterns exhibit clear directional separation, indicating strong discriminatory power of event intensity.
Figure 3:CAAR Group Comparison Chart (P-MO)
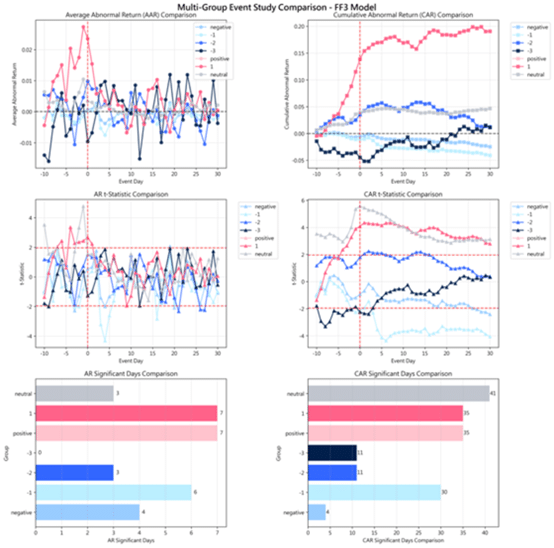
Market reactions differ by group:
Table 4:Effect Distribution Table (P-MO)
| Group | CAAR(t−1)% | CAAR(t=0)% | CAAR(t+30)% | AAR(t−1)% | AAR(t=0)% | Pre% | t=0% | Post% | Post-Ret% |
|---|---|---|---|---|---|---|---|---|---|
| 1 | 11.52 | 13.86 | +19.05 | 2.72 | 2.34 | 60.5 | 12.3 | 27.2 | +5.19 |
| positive | 11.52 | 13.86 | +19.05 | 2.72 | 2.34 | 60.5 | 12.3 | 27.2 | +5.19 |
| neutral | 3.57 | 3.87 | +4.64 | 1.02 | 0.30 | 76.9 | 6.5 | 16.6 | +0.77 |
| negative | −0.62 | −0.51 | −2.41 | 0.02 | 0.11 | 25.6 | −4.5 | 78.9 | −1.90 |
| −1 | −1.07 | −1.04 | −4.03 | −0.13 | 0.02 | 26.4 | −0.5 | 74.1 | −2.99 |
| −2 | 2.53 | 3.53 | +1.27 | 0.48 | 1.00 | 199.6 | 78.7 | −178.3 | −2.26 |
| −3 | −3.50 | −4.46 | +1.16 | 0.22 | −0.96 | −301.6 | −82.8 | 484.4 | +5.62 |
The positive group demonstrates strong return potential, with a total CAAR of +19.05% and post-event return of +5.19%, suggesting tradability even after disclosure. However, with 60.5% of returns realized pre-event, timing becomes critical.
The negative group shows a CAAR of −2.41%, with the −1 subgroup reaching −4.03% and post-event return of −2.99%, indicating clear post-event momentum. In contrast, the −2 and −3 groups lack sufficient statistical robustness.
N-MO events share the same underlying theme as P-MO but are sourced from media reports.
Compared to official disclosures, news-driven governance events:
Figure 5 presents the distribution of event scores. A total of 551 events are observed:
Figure 5:Event Sample Distribution (N-MO)
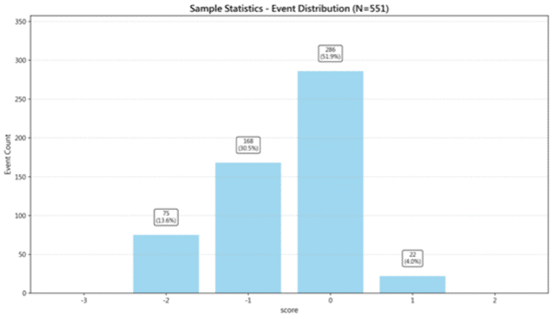
Table 6:Detailed Statistical Results (N-MO)
| Group | Event Count | Mean AAR (%) | Final CAAR (%) |
|---|---|---|---|
| 1 | 22 | 0.052 | +2.13 |
| positive | 22 | 0.052 | +2.13 |
| neutral | 286 | −0.076 | −3.10*** |
| negative | 243 | −0.118 | −4.90*** |
| −1 | 168 | −0.093 | −3.86*** |
| −2 | 75 | −0.175 | −7.17*** |
CAAR exhibits a monotonic decreasing pattern, confirming directional validity of the WD scoring system.
Notably, the neutral group shows −3.10% CAAR, in contrast to +4.64% in P-MO, highlighting systematic differences between news and announcement channels.
Figure 7:CAAR Group Comparison Chart (N-MO)
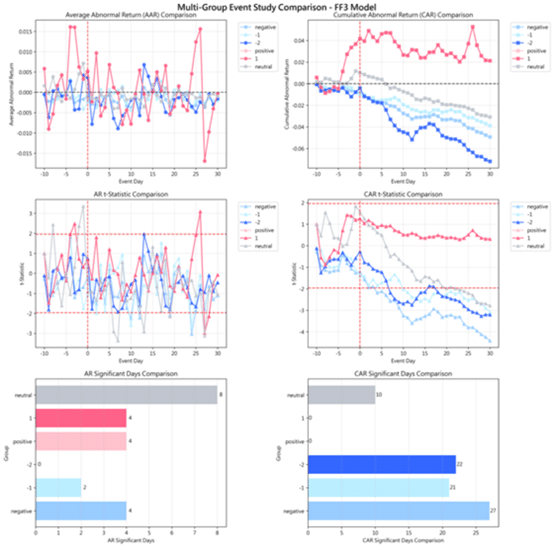
Returns are highly concentrated post-event, indicating delayed market adjustment.
Table 8:Effect Distribution Table (N-MO)
| Group | CAAR(t−1)% | CAAR(t=0)% | CAAR(t+30)% | AAR(t−1)% | AAR(t=0)% | Pre% | t=0% | Post% | Post-Ret% |
|---|---|---|---|---|---|---|---|---|---|
| 1 | +3.67 | +4.18 | +2.13 | +0.32 | +0.51 | 172.4 | 24.1 | −96.5 | −2.05 |
| positive | +3.67 | +4.18 | +2.13 | +0.32 | +0.51 | 172.4 | 24.1 | −96.5 | −2.05 |
| neutral | +1.16 | +0.99 | −3.10 | +0.70 | −0.17 | −37.6 | 5.5 | 132.1 | −4.09 |
| negative | −0.75 | −0.79 | −4.90 | −0.14 | −0.03 | 15.4 | 0.7 | 83.9 | −4.11 |
| −1 | −0.75 | −0.97 | −3.86 | −0.40 | −0.22 | 19.4 | 5.6 | 75.0 | −2.90 |
| −2 | −0.76 | −0.39 | −7.17 | +0.43 | +0.37 | 10.6 | −5.2 | 94.6 | −6.78 |
Negative events display strong and persistent downside signals:
This structure supports clear short-side trading opportunities.
Neutral events also exhibit negative bias, suggesting systematic pessimism in market interpretation of governance news. Positive signals remain statistically weak.
This chapter examines “Corporate Control Events” across different sources (News N vs. Announcements P). Results confirm that even for identical events, the information source significantly alters the market’s digestion path and response pace:
In summary, the information source dictates market digestion speed. This granular dimension helps investors find precise entry points for “early positioning,” “trend following,” and “risk hedging.”
