
Table of Contents
Gabriel Watson is a well-known American growth-momentum portfolio manager. In his early career, he worked at Morgan Stanley Investment Management and William O’Neil & Co., where he accumulated extensive market research experience. Since joining Black Rose Capital Management in 1998, Watson has broken away from the confines of traditional value investing and developed a systematic, rule-based stock-picking method centered on “revenue momentum and price strength.” He calls this framework “The Machine.” In an environment characterized by rapid information flow and swift capital rotation, this approach has enabled him to capture the powerful upward moves of leading stocks.
The core of Watson’s strategy is to identify companies with accelerating revenue growth while requiring their price and trading volume to show simultaneous strength, signaling that the fundamentals are being recognized by the market. This methodology famously picked Netbank during the 1998–1999 period, which soared more than 700% in less than a year, cementing Watson’s reputation in momentum investing. Unlike the entry logic of value investors, who look for undervaluation, Watson focuses on growing companies and executes trades entirely on data-driven, quantitative rules. The result is a distinctive, highly responsive investment system that emphasizes immediacy and flexibility.
This study selects all companies listed on the Taiwan Stock Exchange (TWSE) and the Taipei Exchange (TPEx) as the investment universe. We collect stock prices, financial statements, and insider shareholding data starting from 2013, followed by data cleaning and integration. Since the strategy design requires referencing the most recent three years of financial information, the effective backtesting window is set from January 1, 2017, to May 1, 2025. Only eligible firms are included in the historical performance simulation, ensuring both data integrity and the rigor of strategy evaluation.
The strategy draws inspiration from Gabriel Watson’s momentum-growth stock selection logic at Blackrose Capital, which emphasizes “revenue growth + price momentum.” We translate this into six concrete quantitative conditions and adjust them to align with the characteristics of the Taiwan market, incorporating a ranking and scoring system. The stock selection process combines fundamental growth potential with market recognition, aiming to identify companies that exhibit rapid operational expansion, strong share price performance, and high investor attention.
To exclude very small-cap companies with limited transparency and higher liquidity risk, the strategy sets market capitalization as a baseline filter. Specifically, we retain only firms whose market capitalization ranks within the top 80% of the market, thereby removing the bottom 20%. This ensures basic conditions for institutional participation and analyst coverage.
Rapid revenue expansion over the past year indicates recent improvements in fundamentals, rising industry demand, or market share gains, all of which raise the likelihood of becoming market leaders. Thus, the strategy requires that a firm’s trailing 12-month revenue growth rate be in the top 20% of the market (> 80th percentile).
Consistency between short-term and long-term growth improves sustainability and operational stability. Therefore, the strategy includes a condition requiring three-year revenue growth to rank within the top 40% of the market (> 60th percentile), filtering out firms with only short-lived spikes and questionable long-term prospects.
- Trailing 12-Month Average Monthly Turnover > 60th Percentile
Turnover ratio serves as a proxy for liquidity and investor attention. To avoid illiquid stocks that are difficult to trade in practice, the strategy excludes firms whose average monthly turnover over the past 12 months ranks in the bottom 40% of the market, retaining only the top 60%.
Price reflects the market’s aggregated information. Strong price performance over the past year suggests that revenue growth and earnings potential have already gained investor recognition. The strategy therefore selects only stocks with trailing 12-month price appreciation ranking in the top 20% of the market (> 80th percentile).
Three-Month Cumulative Revenue Growth in Top 40%
To address the lagging nature of traditional annual revenue growth indicators in capturing current-quarter trends, we incorporate three-month cumulative revenue growth as an additional screening factor. Firms must rank within the top 40% of the market (> 60th percentile) on this measure.
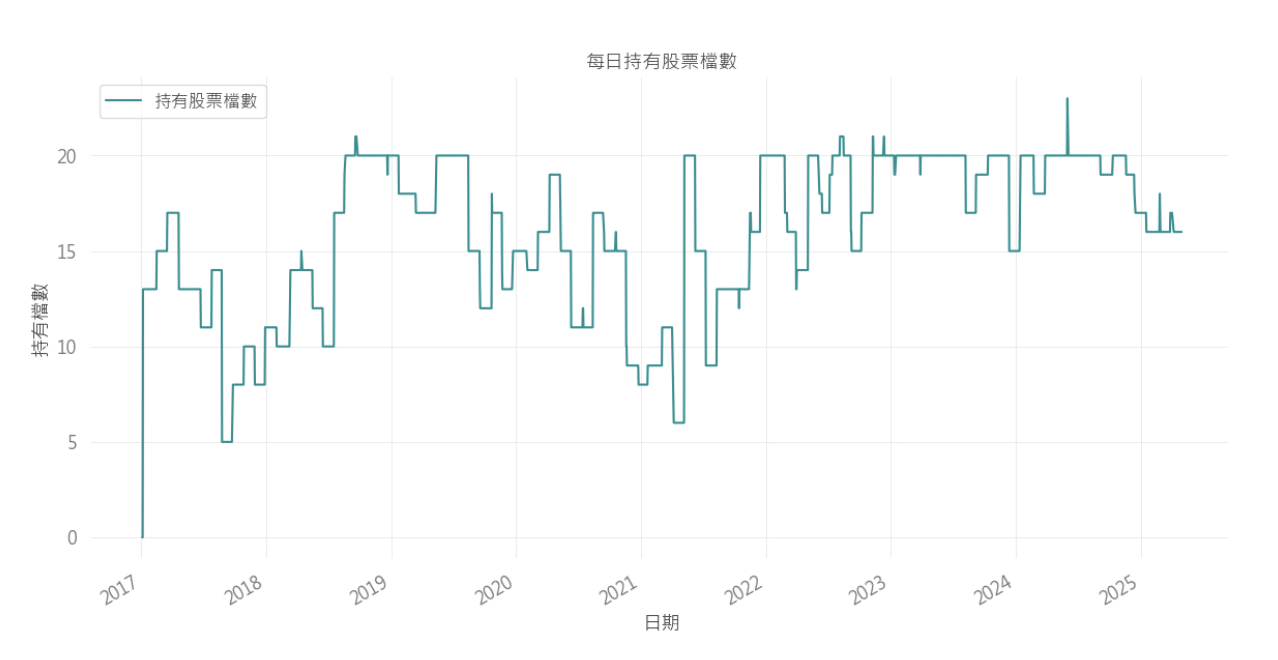
In practice, stocks that pass all the screening conditions are selected into the portfolio and purchased on an equal-weighted basis, then held until the next rebalancing date. The rebalancing frequency is set to every 21 trading days, at which point the portfolio is refreshed based on the updated screening results.
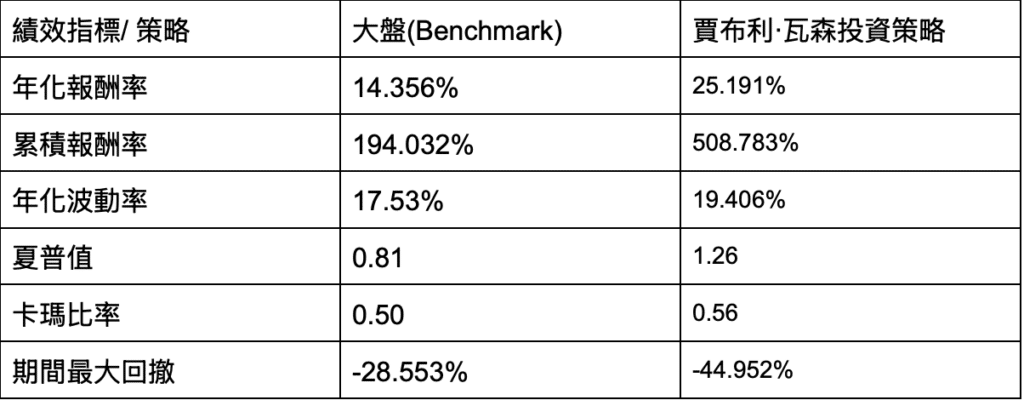
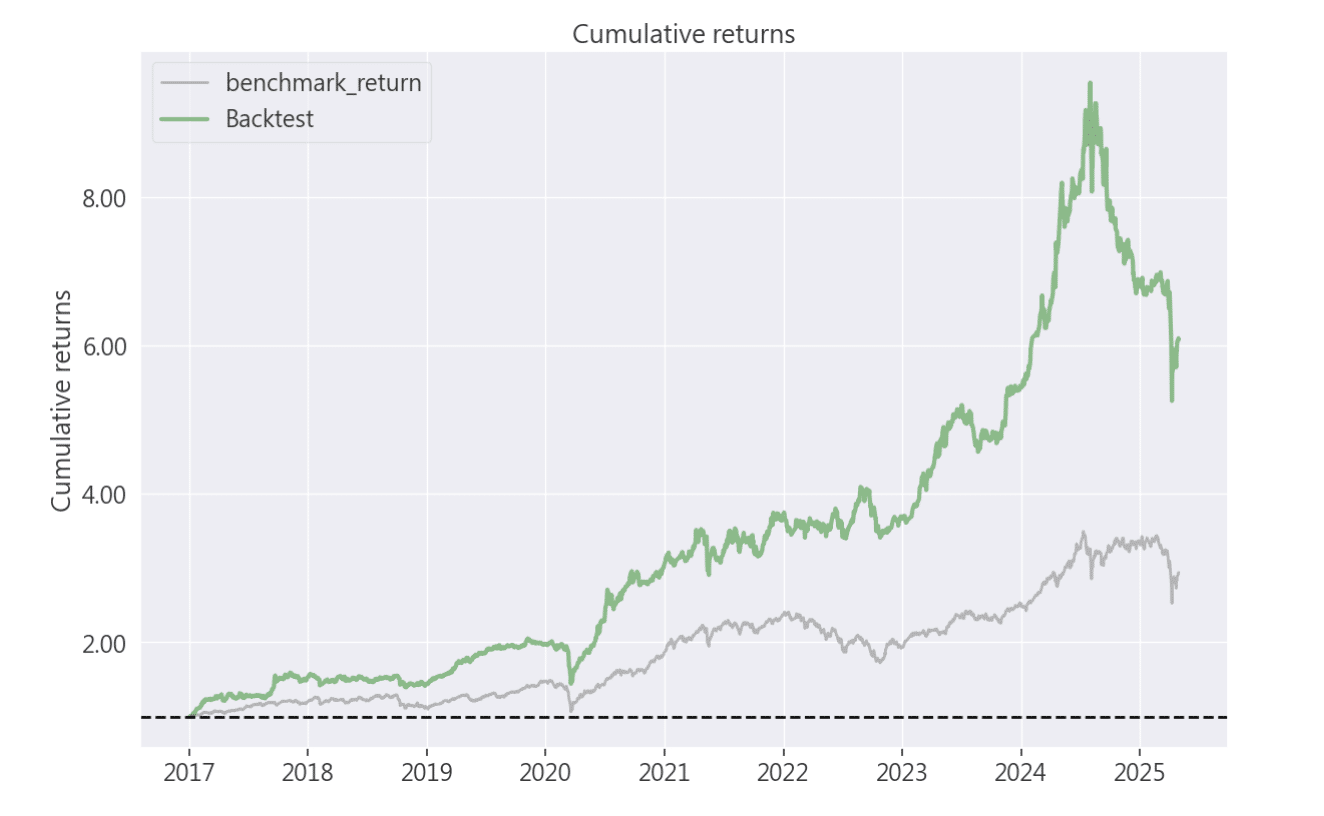
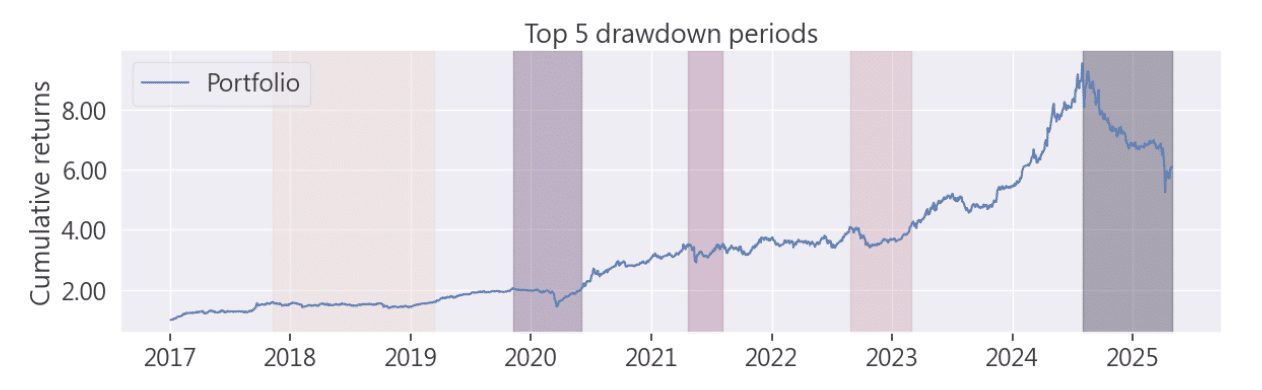
From the cumulative return chart spanning 2017 to 2025, the strategy consistently outperforms the benchmark index during most periods. In particular, between 2020 and 2024, the strategy demonstrates a strong upward trend, ultimately achieving a cumulative return of 508.783%, significantly higher than the benchmark’s 194.032% over the same horizon.
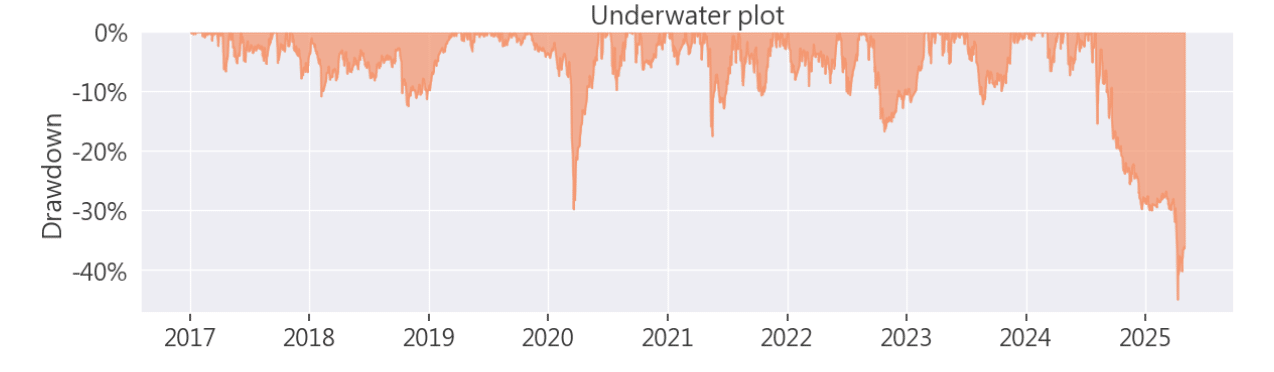
However, portfolio management and position control remain areas for improvement under extreme market conditions. For example, during the bear market in 2025, the lack of an effective stop-loss mechanism led to substantial drawdowns, with the strategy giving back a considerable portion of its prior gains amid heightened volatility.
This analysis is shared as a reference for interested investors. We will continue introducing how to construct and backtest various indicators using the TEJ database, and showcase their performance through the TQuant Lab platform. Readers who are interested in systematic backtesting and strategy design are encouraged to explore the solutions offered, leveraging high-quality databases to develop customized trading strategies.
Disclaimer: This analysis is for informational purposes only and does not constitute investment advice or recommendations for any financial products.
【TQuant Lab Backtesting System】Solving Your Quantitative Finance Pain Points
From Business Cycle Indicators to Asset Rotation: A Quantitative Strategy to Avoid Bear Markets
Michael Murphy’s Risk Assessment Rules for Investing in High-Tech Stocks
Charles Brandes’ Value Investing Principles : Building a Portfolio with a Margin of Safety
