
Table of Contents
Hi everyone! Today, I’d like to dive into the fascinating world of quantitative finance with you.
Before we get into the details, let me share why I’m so passionate about quantitative finance and chose the TQuant Lab platform. Like many of you, I’ve always dreamed of financial freedom. My journey began with an early interest in stock trading. I watched countless videos of financial advisors, market analysis programs, and news reports. Yet, I was always left wondering—what is the right way to invest? If you’ve had the same doubts, you’re not alone. While seeking answers, I stumbled upon a term that was entirely new to me: quantitative finance.
For those of you reading this article, I assume you’re also intrigued by quantitative finance. Learning this field helps resolve personal financial challenges and enhances career competitiveness. More importantly, it sharpens your logical thinking and data analysis skills—benefits that are hard to overlook.
The term “quantitative” refers to the process of transforming objects or even events into numerical data. While the financial world is inherently complex and not everything is easily measurable, advancements in technology and the explosion of market data have made quantitative finance indispensable in modern investing. Unlike traditional investment strategies that rely on experience and fundamental analysis, quantitative trading leverages data analysis and mathematical models to deliver precise and efficient investment decisions.
In this field, we often use statistical and mathematical models alongside programming to analyze historical stock trading data and develop actionable trading strategies, ultimately improving investment performance.
Trading data is not limited to daily stock prices, highs, lows, volumes, or fundamentals; it can even include breaking news or events. Any data that can be quantified is fair game in the realm of quantitative finance.
If your interest in quantitative trading has been piqued, you’re probably wondering: Which tools should I use? Let me introduce you to one of my favorites—TQuant Lab. Developed by TEJ, this platform stands out from other tools in several key ways:
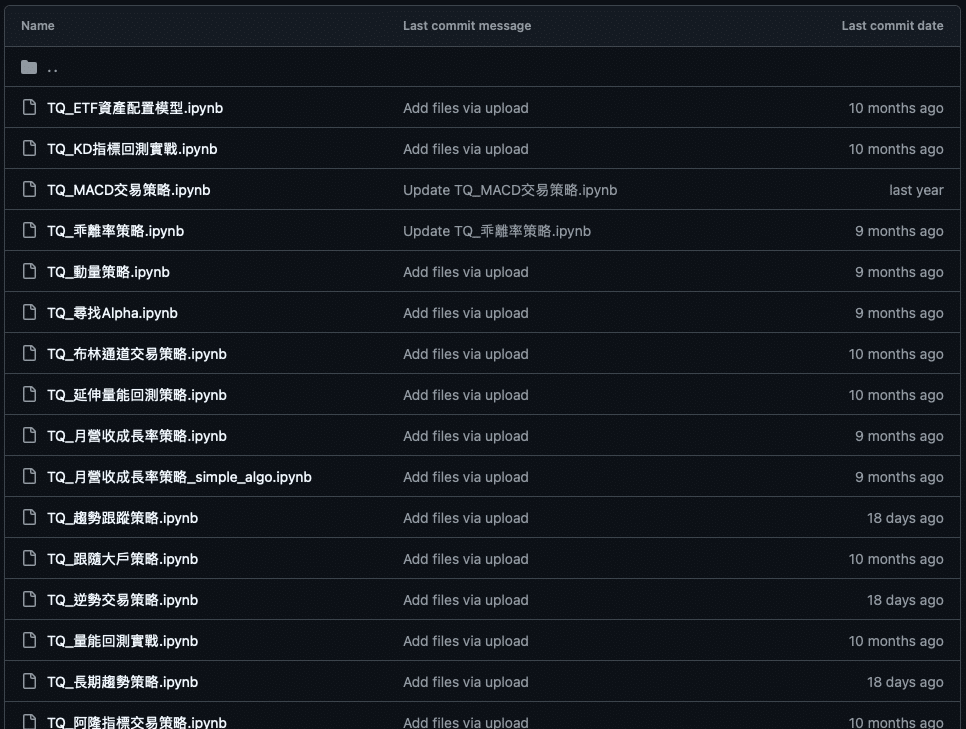
For programming novices, building a quantitative trading system might feel overwhelming. But with such rich learning materials, there’s no excuse not to start!
How to Begin with TQuant Lab?
Let’s take a closer look at this powerful tool and its capabilities:
Suppose you’re interested in taking your first steps into quantitative finance. In that case, TQuant Lab provides everything you need to get started efficiently and effectively. Let’s embark on this journey together and explore the endless possibilities of quantitative trading!
