
Table of Contents
Howard Rothman is the Chief Investment Analyst at Vision Investment Advisor (VIA), a well-known investment firm on Wall Street. Under his leadership, the “Blue Chip Growth Account,” launched in 1997, achieved a cumulative return of 49.27% by 2001—more than double the performance of the S&P 500 index over the same period—and consistently outperformed the market each year.
As of December 2002, Rothman had become President of Vision Investment Advisor. He also served as Chairman and founding member of the National Introducing Brokers Association and was appointed to the Board of Directors of the National Futures Association (NFA) in 1990, serving three consecutive terms. He actively contributed to the NFA’s Legal and Compliance Committees, demonstrating his strong professional background and influential presence in the industry.
Rothman’s core investment philosophy is to “buy right and hold tight” or “buy strong and hold long.” He emphasizes selecting financially sound companies with stable and growing earnings, purchasing them at the right price, and holding them patiently for the long term. Without frequent portfolio adjustments, investors can achieve strong long-term returns. This simple yet resolute investment approach reflects Rothman’s practical wisdom and provides a clear, historically validated foundation for the strategy tested in this study.
The core spirit of this strategy is rooted in Howard Rothman’s investment philosophy—selecting fundamentally sound, high-quality companies with growth potential, entering positions at the right time, and holding them long-term to pursue stable returns. To embody this principle, we designed a concrete and rigorous screening mechanism to identify stocks with steady profitability and growth potential across the entire market. The selection criteria are as follows:
By applying this multi-layered screening approach, we aim to precisely identify companies that are financially solid, operationally healthy, and clearly growth-oriented, thereby constructing a pool of stocks with long-term investment value as the foundation for further backtesting and strategy development.
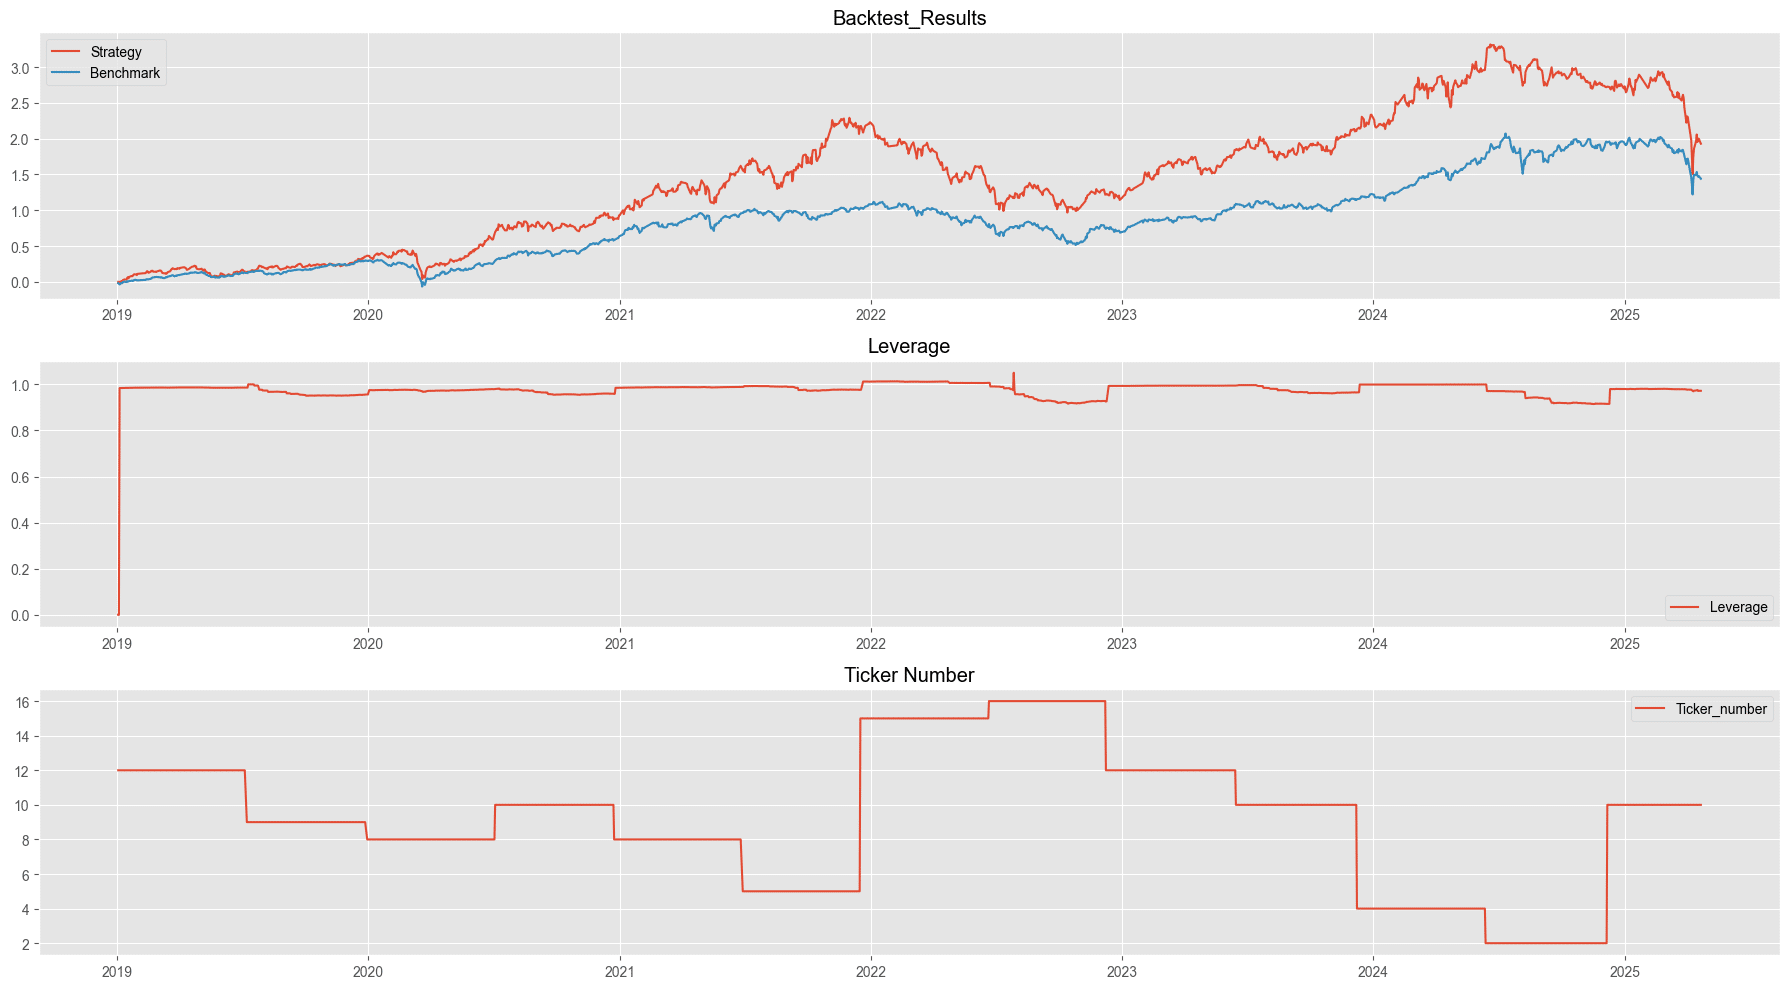
The chart above displays the strategy’s cumulative return, leverage usage, and the number of stocks held in the portfolio. From the leverage line chart, we can observe that the strategy did not employ excessive leverage during the backtesting period, nor did it hold excessive cash reserves that would have undermined overall returns. In terms of the number of stocks invested, the strategy consistently held an average of around 10 stocks after each screening cycle. This indicates a moderate level of stringency in the screening criteria—strict enough to avoid including all stocks, yet not so loose as to cause over-diversification that would dilute performance and align too closely with the overall market.
Looking at the cumulative return chart, the strategy outperformed the market primarily during two periods: from early 2020 to early 2022, and again from early 2023 to May–June 2024. These periods correspond closely to major market uptrends. Conversely, the strategy underperformed during the periods from 2022 to early 2023 and from mid-2024 to the present, as indicated by the narrowing gap between the two performance lines. These periods coincided with market downturns or consolidation phases.
We therefore conclude that this strategy, based on value investing principles, tends to perform better during bull markets when stock prices more accurately reflect company fundamentals. In contrast, during bear markets, emotional factors tend to dominate and distort short-term prices, which significantly reduces the effectiveness of value-based investing.
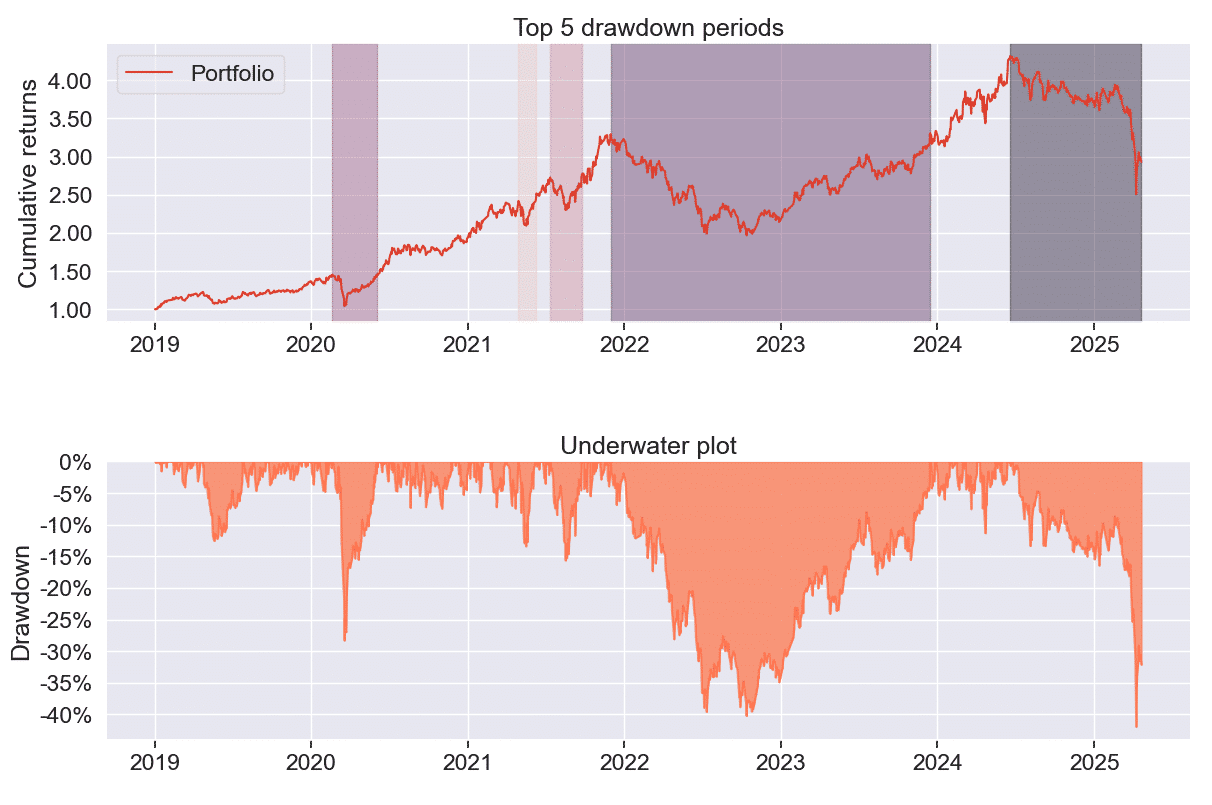
From the chart above, it is evident that the period from 2022 to early 2024 marks the largest drawdown for the strategy. This suggests that the strategy relies heavily on overall market conditions and is not consistently capable of generating excess returns across different market environments. Therefore, it is important to evaluate market conditions before deciding whether to implement this strategy.
| Performance Metric / Strategy | Benchmark | Howard Rothman’s Investment Strategy |
| Annualized Return | 14.5% | 19.43% |
| Cumulative Return | 126.97% | 193% |
| Annualized Volatility | 17.08% | 26.43% |
| Sharpe Ratio | 0.88 | 0.8 |
| Calmar Ratio | 0.55 | 0.46 |
| Maximum Drawdown during the period | – 26.295% | – 41.937% |
Important Reminder: This analysis is for reference only and does not constitute any product or investment advice.
We welcome readers interested in various trading strategies to consider purchasing relevant solutions from Quantitative Finance Solution. With our high-quality databases, you can construct a trading strategy that suits your needs.
“Taiwan stock market data, TEJ collect it all.”
The characteristics of the Taiwan stock market differ from those of other European and American markets. Especially in the first quarter of 2024, with the Taiwan Stock Exchange reaching a new high of 20,000 points due to the rise in TSMC’s stock price, global institutional investors are paying more attention to the performance of the Taiwan stock market.
Taiwan Economical Journal (TEJ), a financial database established in Taiwan for over 30 years, serves local financial institutions and academic institutions, and has long-term cooperation with internationally renowned data providers, providing high-quality financial data for five financial markets in Asia.
With TEJ’s assistance, you can access relevant information about major stock markets in Asia, such as securities market, financials data, enterprise operations, board of directors, sustainability data, etc., providing investors with timely and high-quality content. Additionally, TEJ offers advisory services to help solve problems in theoretical practice and financial management!
From Business Cycle Indicators to Asset Rotation: A Quantitative Strategy to Avoid Bear Markets
Michael Murphy’s Risk Assessment Rules for Investing in High-Tech Stocks
Charles Brandes’ Value Investing Principles : Building a Portfolio with a Margin of Safety
