
Table of Contents
According to the Security and Exchange Act, within the first ten days of each calendar month publicly announce and register with the Competent Authority the operating status for the month. In addition to the real-time information of monthly revenue compared with financial reports, it can also assist investors in tracking company fundamentals during the window period of yearly financial reports. Therefore, monthly revenue information has become one of the most important reference indicators for investors to grasp changes in the company’s fundamentals. There are some studies, such as Chen Daiyou (2021), also pointed out that monthly revenue information has information connotations. However, because the company’s monthly revenue announcement date is not easy to obtain, many studies assume that its announcement was on the 10th, and the analysis results did not reach the point-in-time spirit at the time of the backtest. In addition, the stock pool only uses the latest data as the research sample, which will also cause the analysis results to be biased due to the survivorship bias. Therefore, the second part of this article will further discuss the impact of Point-in-Time and survivorship bias on quantitative analysis. In the third part, we use TEJ API to obtain monthly revenue announcement date data, as well as a complete stock pool sample containing the latest and past, to make a preliminary visual analysis of monthly revenue information. The fourth part further uses investment portfolio analysis to study and explore the connotation of monthly revenue information. Last, it summarizes the results of the analysis in this paper.

Point-in-Time means that the historical data of the research is the information available at the current point in time. The use of it for quantitative analysis and research can avoid peeking into future data and making inaccurate lagging assumptions, and make the results of the analysis closer to the actual situation. The survivorship bias refers to the analysis of only the samples after screening, ignoring the information covered by the samples removed during the screening process, which causes serious errors in the analysis results. A more famous example is the “Bomber Protection” case. Because both will have a direct impact on the results in the quantitative analysis process, the monthly revenue information in the following figure is used as an example for further explanation.
Following figure 2.1 below, it uses the constituent stocks of Taiwan’s mid-cap 100 stock index as a sample and uses the monthly revenue growth rate as a stock selection indicator to construct an investment portfolio. And under the condition of using three different data, different color portfolio net worth curves are generated respectively. The green line is based on the latest index constituent stocks as a sample. After obtaining monthly revenue data in real-time, the investment portfolio is formed by stock selection, that is, using Point-in-Time data, but with survivor bias. The light blue line is a sample of the latest and past index constituent stocks, but it is assumed that the monthly revenue information is announced on the 10th of each month and the stock selection is formed after the stock selection, that is, no Point-in-Time data is used, but there is Avoid survivors’ deviations. The blue line not only uses the latest and past index stocks as samples but also adjusts the investment portfolio in a timely manner when obtaining the latest monthly revenue information, that is, using Point-in-Time data to avoid survivor bias factors. The red line is the net value curve of the mid-cap 100 index.
By analyzing the trend of the four net worth curves, the results show that the blue line considers the real-time data and survivor deviation factors. The net worth curve trend is closest to the actual results, and the overall performance is better than the medium 100 index; however, the green line is due to the existence of survivor bias. Overestimate the performance of the portfolio; the light blue line underestimates the performance of the portfolio due to lagging assumptions. It can be seen that Point-in-Time data and survivorship bias will have a great impact on the results of quantitative analysis. Therefore, the subsequent research and analysis of this article will use TEJ API to obtain Point-in-time data on the monthly revenue announcement date. In addition, the data of index constituent stocks are also captured to solve the problem of survivor bias.
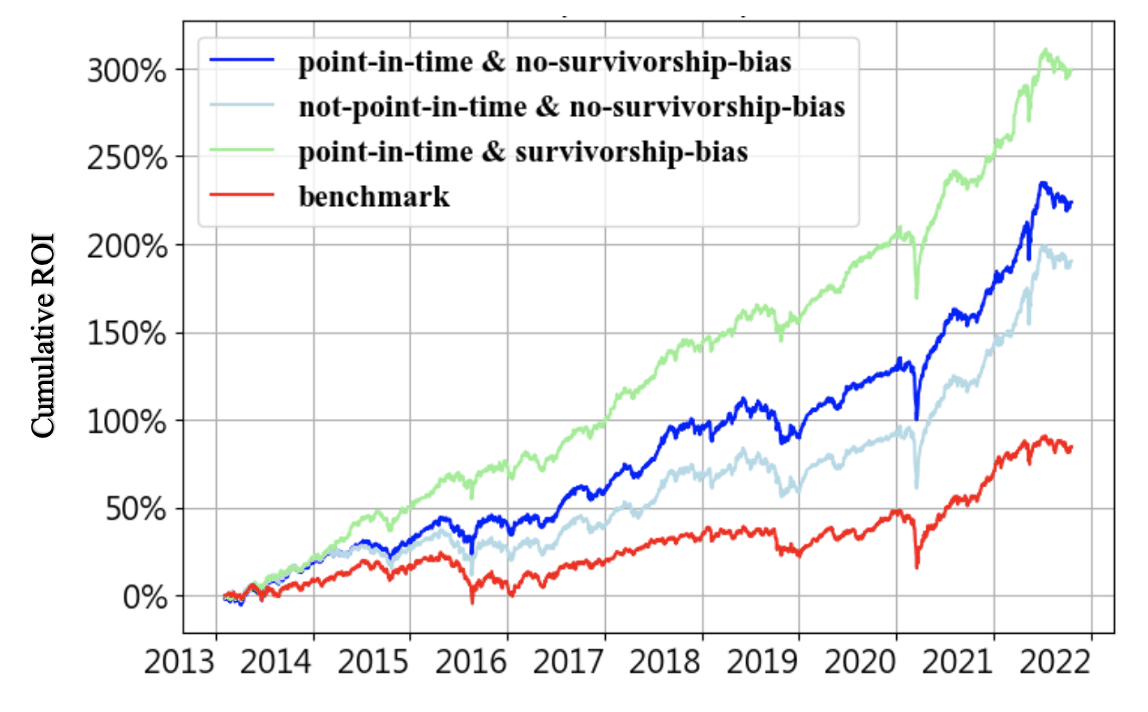
Figure2.1 Effect on portfolio by different data conditions
Monthly revenue information is one of the most important reference indicators for investors to grasp changes in the company’s fundamentals. Generally speaking, investors use it to evaluate the growth or decline of the company’s performance as a basis for buying and selling stocks. When the monthly revenue grows, investors tend to buy stocks; conversely, when the monthly revenue declines, investors tend to sell stocks.
The data in Figure 3.1 below is taken from TEJ API. Taking the constituent stocks of the mid-cap 100 index from 2013 to 2021 as a sample, the time series chart of the monthly revenue growth rate of top95%, median50%, and bottom5% is drawn. Among them, the average annual growth rate of monthly revenue of top95% is more than 30%, median50% is more than 0%, and bottom5% is between -50%-0%. On the whole, the trend of the mid-cap 100 stock price index and the annual growth rate of monthly revenue is roughly the same. In the decline period of the index from 2014 to mid-2015, 2018 to 2019, and the rising period of the index from 2016 to 2018, and March 2020 to 2021, the stock price showed a rise and fall along with the annual growth rate of monthly revenue. . The data shows that the monthly revenue growth rate is positively correlated with the stock price index, and changes in fundamentals affect the future ups and downs of stock prices. Therefore, the next paragraph will further use portfolio analysis to test the information content of monthly revenue.
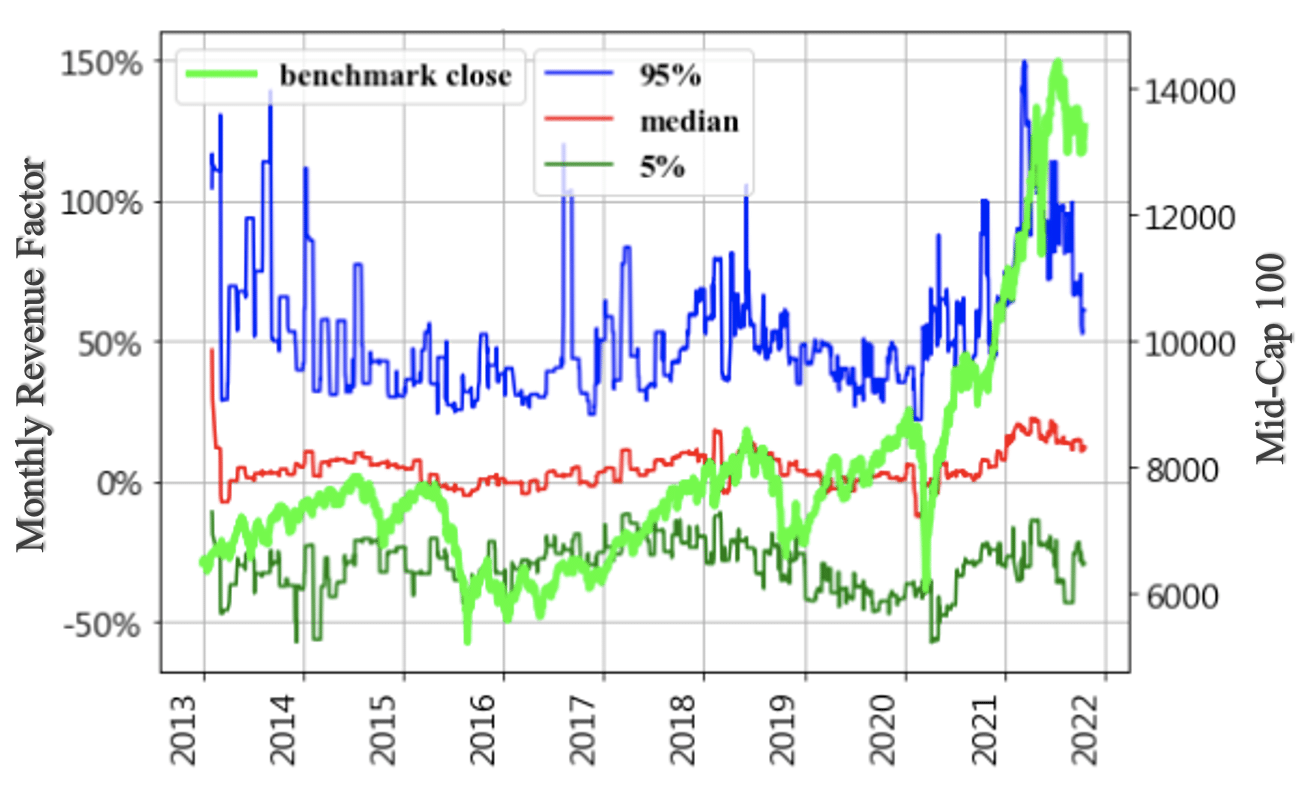
FIgure3.1 Monthly Revenue Annual Growth Rate, 5%, 50%, 95%

Portfolio analysis is to use the monthly revenue annual growth rate to sort the stocks in the sample pool after the company’s monthly revenue is announced, and group the stocks according to the sorting results to form a portfolio, which will be held and adjusted until the next monthly report is announced. To analyze the relationship between portfolio return and groupings, and whether hedging portfolios can make a profit. In order to test whether the monthly revenue growth rate information can be used to predict the expected return rate of stocks.
The data in the following figure is taken from TEJ API. The obtained data includes the announcement date of the company’s monthly revenue and the complete stock pool sample including the latest and past. The data period is from 2013 to 2021, using the mid-cap 100 index constituent stocks as a sample, and the analysis results are as follows. Figure 4.1 shows that the annualized rate of return of the investment portfolio constructed by using the monthly revenue growth rate information is higher with the higher the group (that is, the group with the higher the monthly revenue growth rate). In addition, as shown in Figure 4.2, the cumulative returns of the Q4 and Q5 portfolios are stable and better than the mid-cap 100 index. On the contrary, the cumulative returns of the Q1 and Q2 portfolios are both stable and worse than the mid-cap 100 index. Finally, looking at Figure 4.3, the net value curve of the long-short hedged portfolio is not affected by the fluctuation of the market momentum and obtains a stable alpha return.
On the whole, the monthly revenue annual rate information can be used to predict the expected return rate of stocks, showing that the monthly revenue information has information connotations. And by buying a portfolio with a high annual growth rate of monthly revenue, and selling a portfolio with a low annual growth rate of monthly revenue, the constructed long-short hedged portfolio can obtain stable alpha income.
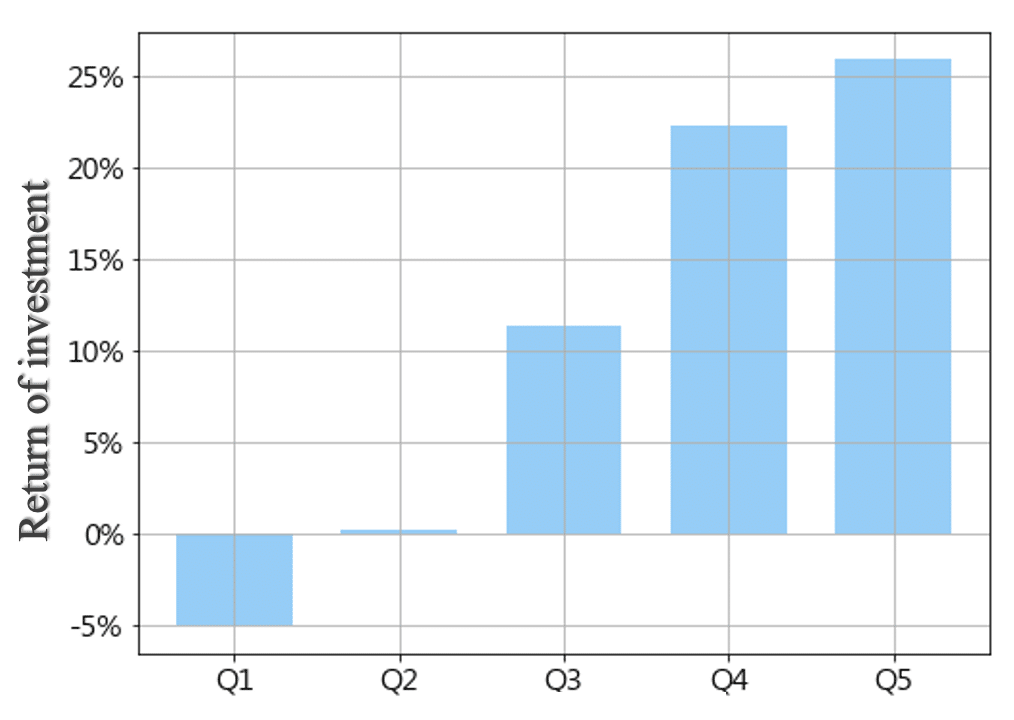
Figure4.1 Portfolio Internal Rate of Return-sortied by Monthly Revenue Annual Growth Rate
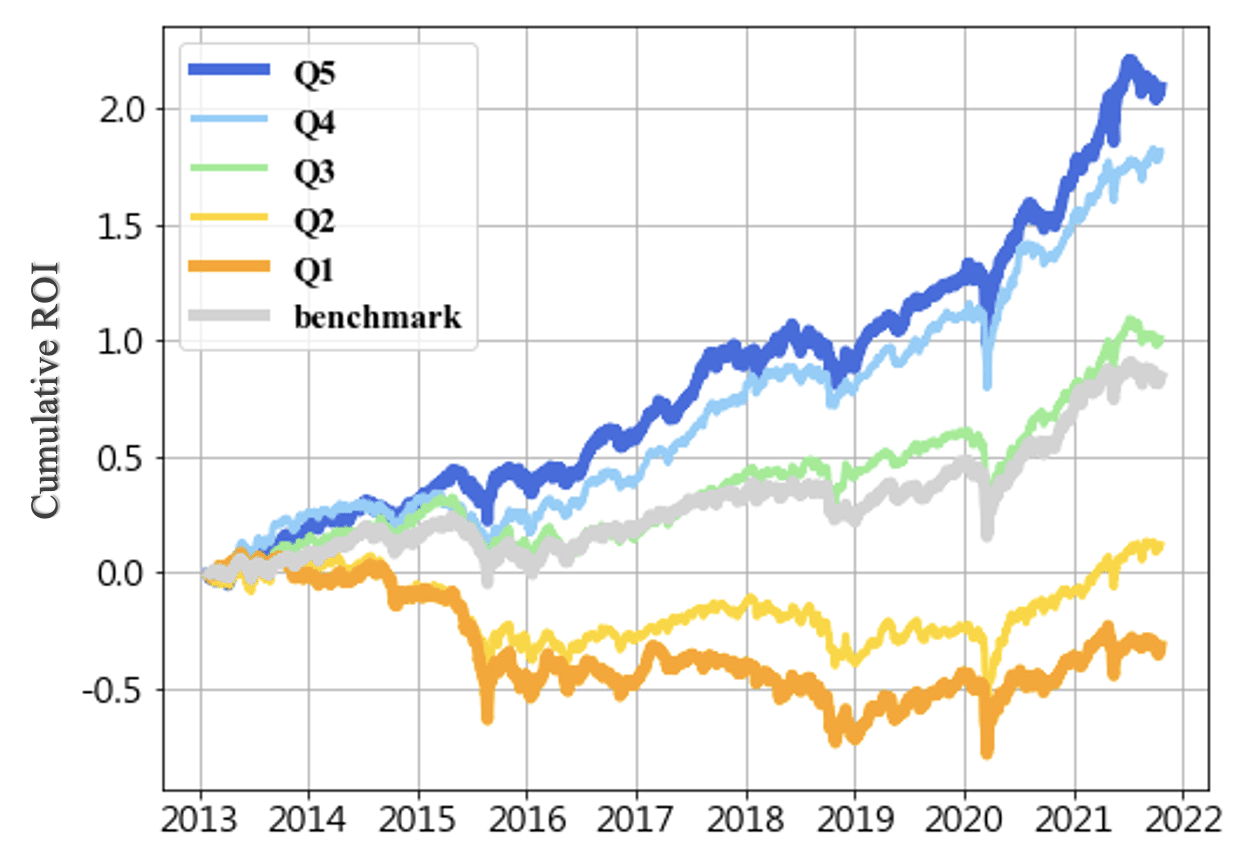
Figure4.2 Portfolio Cumulative Return-sorted by Monthly Revenue Growth Rate
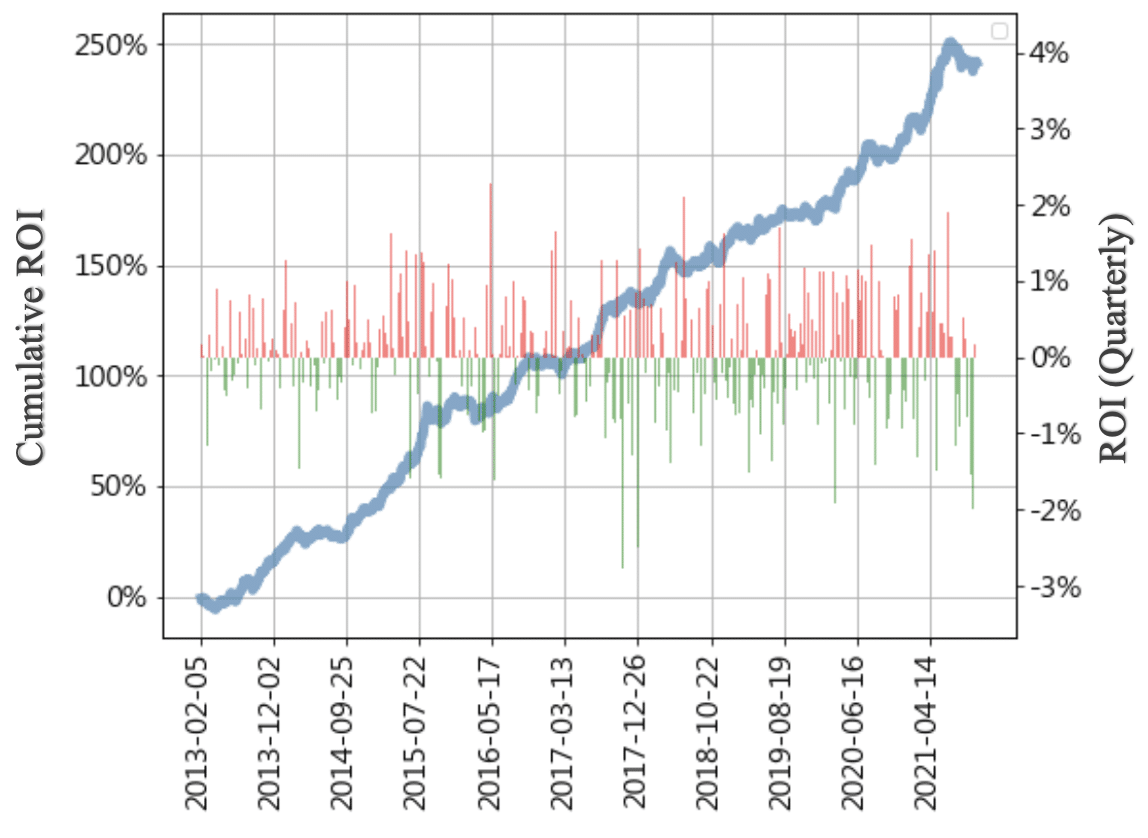
Figure4.3 Hedge Portfolio Cumulative Return Rate
The article uses Point-in-Time to explore the contents of the monthly revenue and uses the TEJ API to grab the relevant data. In addition to comparing the influence of Point-in-Time data and survivorship deviation factors to cause ambiguous analysis results, it is also possible to explore the positive relationship between monthly revenue and stock prices. Finally, the portfolio analysis is adopted that the monthly income increase can not only predict stock expectation earning rate, but through a hedge investment portfolio, it is more able to obtain stable Alpha income, and the information content is really information connotation. It is recommended to activate the TEJ API trial, using the Point-Int-Time information to explore more information about the financial market.
