
Photo from Unflash by Markus Spiske
Table of Contents
In the world of investing, accurate predictions and systematic analysis are key to achieving long-term success. Strategists who can decipher market trends become sought-after figures for investors eager to learn. Michael Sivy is undoubtedly one of the best. With precise market forecasts and unique investment insights, he has built a stellar reputation in the U.S. investment community.
From warning of the 1987 stock market crash to predicting a market turnaround in 1995 and foreseeing the bursting of the tech bubble in 1999, Sivy has demonstrated exceptional market foresight through decades of research and hands-on experience. His book, The Rule of 72, has become a must-read classic, offering systematic analysis and clear guidelines for investors of all types.
This article will focus on Sivy’s investment philosophy, particularly the four key principles he established for income investors: high yield, stable growth, strong financial health, and reasonable valuation. By analyzing his classic cases, we will explore how these principles maximize returns in real-world investing and provide valuable insights for today’s market environment.
Michael Sivy places great emphasis on a company’s various yield metrics, using extensive income-related data for stock screening. Additionally, he evaluates a company’s operational performance by examining its debt levels and asset liquidity to ensure the company maintains a solid financial foundation.
Stock Selection Criteria:
Stocks are selected based on the five criteria above and adjusted at the end of each quarter. The following setting for assess whether Michael Sivy’s stock selection strategy can be effectively applied to the Taiwanese stock market.
After obtaining price-volume and historical data, we execute the strategy based on Michael Sivy’s Stock Selection Criteria.
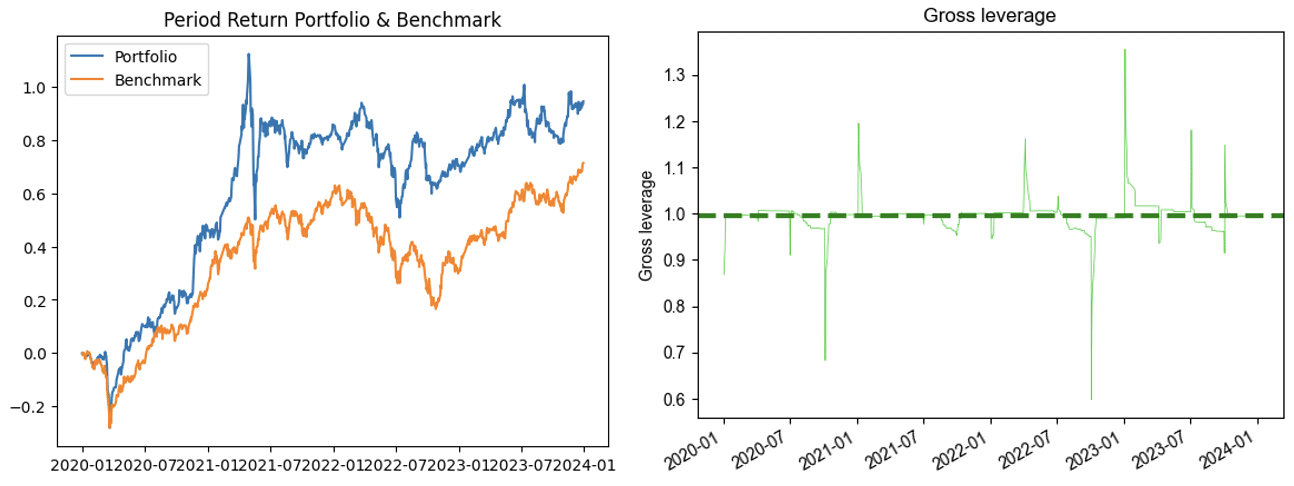
The backtesting period is set from the end of 2019 to the end of 2023. The cumulative return chart indicates that the stock selection strategy slightly outperforms the market, suggesting that it successfully identifies stocks with higher upside potential. However, during market downturns, the strategy experiences more severe drawdowns, highlighting its lack of resilience against systemic market risks.
From the leverage usage chart, leverage fluctuations occur only on rebalancing days, while remaining at zero otherwise. This ensures that the strategy does not face excessive liquidity or capital turnover issues.The annualized return of the strategy is 18.74%, slightly higher than the Taiwan market index, which ranges between 12% and 15%.
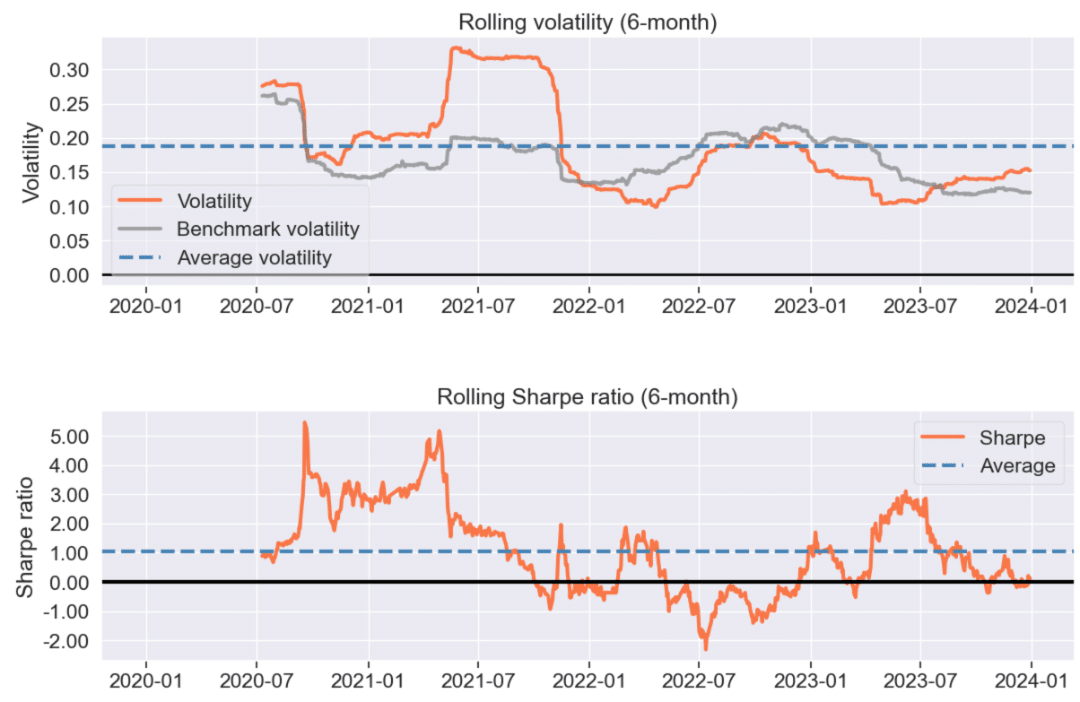
Analysis of Moving Volatility and Moving Sharpe Ratio
From the moving volatility and moving Sharpe ratio charts, a significant increase in volatility can be observed in the second half of 2021. This period coincides with the market correction at the end of the bull market, during which the Taiwan stock market experienced a notable downturn and heightened volatility. However, the strategy’s volatility exceeded that of the overall market.
This suggests that the stock selection method tends to pick stocks with higher upside potential, which, during a bear market, lack the momentum to sustain their prices due to reduced investor inflows. As a result, both the drawdowns and volatility of the strategy were amplified during this period, reflecting its exposure to market risk.
To mitigate this, the strategy’s application could be reduced when the overall market valuation is high (late bull market phase), helping to avoid periods of excessive volatility.
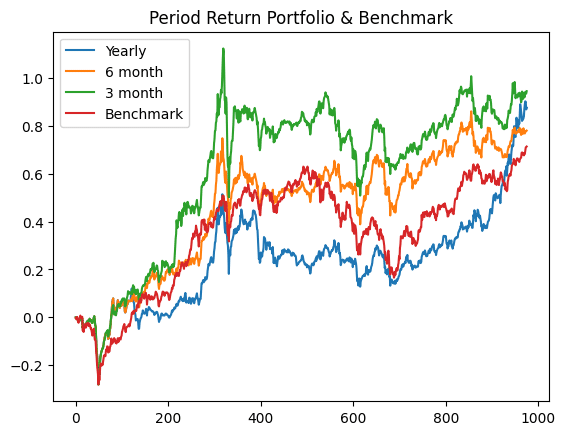
Impact of Different Rebalancing Frequencies on Strategy Performance
We tested the same strategy logic with different rebalancing frequencies, conducting backtests on an annual, semi-annual, and quarterly basis. The results show that higher rebalancing frequency leads to better overall performance.
This suggests that the selected stocks tend to reflect their intrinsic value within a quarter, meaning that more frequent rebalancing captures price movements more effectively. As a result, higher-frequency rebalancing significantly enhances overall strategy performance.
| Statistics | 3month | 6month | yearly | Benchmark |
| Annualized Return | 18.74% | 16.058% | 17.635% | 14.92% |
| Cumulative Return | 94.499% | 78.025% | 87.581% | 71.362% |
| Sharp Ratio | 0.95 | 0.89 | 0.94 | 0.86 |
| Volatility | 20.318% | 18.805% | 19.311% | 18.02% |
| Max Drawdown | -29.274% | -28.394% | -28.394% | -28.553% |
Important Reminder: This analysis is for reference only and does not constitute any product or investment advice.
We welcome readers interested in various trading strategies to consider purchasing relevant solutions from Quantitative Finance Solution. With our high-quality databases, you can construct a trading strategy that suits your needs.
“Taiwan stock market data, TEJ collect it all.”
The characteristics of the Taiwan stock market differ from those of other European and American markets. Especially in the first quarter of 2024, with the Taiwan Stock Exchange reaching a new high of 20,000 points due to the rise in TSMC’s stock price, global institutional investors are paying more attention to the performance of the Taiwan stock market.
Taiwan Economical Journal (TEJ), a financial database established in Taiwan for over 30 years, serves local financial institutions and academic institutions, and has long-term cooperation with internationally renowned data providers, providing high-quality financial data for five financial markets in Asia.
With TEJ’s assistance, you can access relevant information about major stock markets in Asia, such as securities market, financials data, enterprise operations, board of directors, sustainability data, etc., providing investors with timely and high-quality content. Additionally, TEJ offers advisory services to help solve problems in theoretical practice and financial management!
Further Reading
Effects of Financial Restatement on Investment Performance
Analyzing Factor Performance with Alphalens – Price & Volume Factors
