
This article will explore what quantitative data is, outlining its meaning, types, and examples, while briefly viewing its collection and analysis methods.
Table of Contents
Quantitative data refers to information that is measurable and expressed numerically. It is crucial for statistical analysis, answering questions like “how many,” “how often,” or “how much,” providing insights into quantities and frequencies.
Quantitative data can be found in various aspects of daily life. Examples of quantitative data include measurements like weight in kilograms or pounds, age in years, or distance traveled in miles.
In the financial world, examples of quantitative data include daily trading volumes of stocks, a company’s annual revenue growth percentage, interest rates, market capitalization, and more.
Qualitative data and quantitative data are fundamentally different. It is important to understand their characteristics to make the appropriate choice for effective analysis.
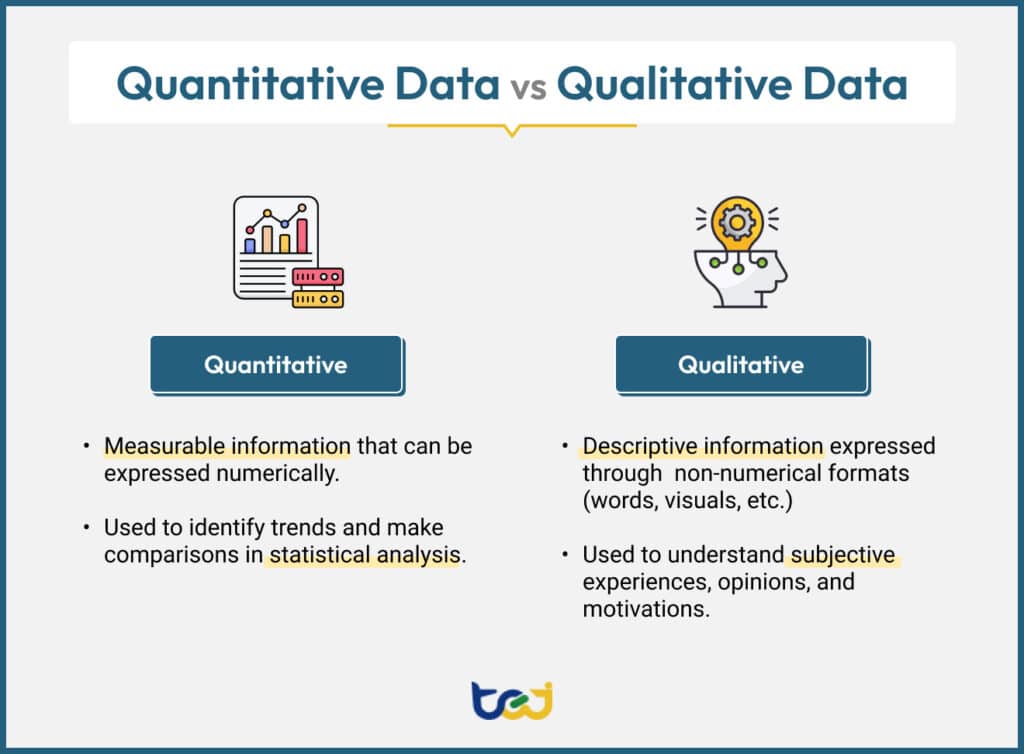
So, what exactly is the difference between quantitative and qualitative data? Unlike quantitative data, which is numerical and measurable, qualitative data is descriptive information expressed through words, visuals, or other non-numerical formats.
Quantitative data also focuses on understanding the “why” behind phenomena, describing the attributes, characteristics, or themes. It is often used to group information according to themes, patterns, or categories derived from observations, interviews, or text analysis.
Examples of qualitative data in the finance industry include customer reviews of financial products, market sentiment analysis derived from news articles or social media posts, expert opinions on market trends, and descriptions of company culture or management style.
Choosing between quantitative and qualitative data depends on the research objectives.
As we’ve mentioned, quantitative data is ideal when you need to measure and analyze numerical information to answer questions like “how many,” “how much,” or “how often.” This means it’s best suited for identifying trends and making comparisons in statistical analysis. For example, if you want to determine the average return on investment for a specific stock over the past year, quantitative data is necessary.
On the other hand, qualitative data is better suited for exploring subjective experiences, opinions, and motivations, as it focuses on the questions “why” and “how”. For example, to understand why investors prefer certain financial products or how they feel about market conditions, qualitative data gathered from interviews, surveys, or sentiment analysis can provide a deeper context.
In many cases, combining both types—quantitative for measurable trends and qualitative for underlying reasons—can yield the most comprehensive insights. As for now, we will continue to focus on quantitative data for this article.
Quantitative data can be further classified into two main types: discrete and continuous.
Discrete data can only take distinct, countable values. This means discrete data are typically whole numbers and cannot be meaningfully divided into fractions. Examples include bond ratings, the total number of trades executed in a day, or a company’s current amount of outstanding shares.
Conversely, continuous data can take any value within a given range while fluctuating over time. Examples include stock prices, interest rates, or currency exchange rates. Their values can be measured with greater precision and can include decimals or fractions.
For details about these discrete data and continuous data, as well as their measurement scales (e.g. nominal, ordinal, interval, or ratio), you can refer to our article here: What is Quantitative Data Analysis: Types, Methods, & Uses
Quantitative data is usually gathered using structured methods to ensure accuracy for analysis. Common quantitative data collection methods include:
Two primary approaches to quantitative data analysis are descriptive and inferential statistics:
Choosing between these methods depends on the research goals; descriptive statistics are used for summarizing data, while inferential statistics are used for making generalizations. Our previous article offers a more in-depth discussion of their particular techniques and applications, so you can check it out to learn more: What is Quantitative Data Analysis: Types, Methods, & Uses.
Quantitative data is fundamental to modern finance, particularly for quantitative traders (quants). Quants rely heavily on numerical data and statistical models to identify trading opportunities and manage risk.
By analyzing vast amounts of historical and real-time data, they can uncover patterns, correlations, and irregularities that might not be apparent through traditional qualitative analysis. This data-driven approach allows them to develop automated trading strategies, optimize portfolios, and make informed investment decisions.

As examples, here are two use cases demonstrating the application of quantitative data in finance:
Quants develop algorithms that automatically execute trades based on predefined criteria derived from quantitative data. For instance, an algorithm might be programmed to buy a stock when its price drops below a certain moving average and sell it when it rises above another threshold, all determined by historical price and volume data.
Important Reminder: This analysis is for reference only and does not constitute any product or investment advice.
We welcome readers interested in various trading strategies to consider purchasing relevant solutions from Quantitative Finance Solution. With our high-quality databases, you can construct a trading strategy that suits your needs.
“Taiwan stock market data, TEJ collect it all.”
The characteristics of the Taiwan stock market differ from those of other European and American markets. Especially in the first quarter of 2024, with the Taiwan Stock Exchange reaching a new high of 20,000 points due to the rise in TSMC’s stock price, global institutional investors are paying more attention to the performance of the Taiwan stock market.
Taiwan Economical Journal (TEJ), a financial database established in Taiwan for over 30 years, serves local financial institutions and academic institutions, and has long-term cooperation with internationally renowned data providers, providing high-quality financial data for five financial markets in Asia.
With TEJ’s assistance, you can access relevant information about major stock markets in Asia, such as securities market, financials data, enterprise operations, board of directors, sustainability data, etc., providing investors with timely and high-quality content. Additionally, TEJ offers advisory services to help solve problems in theoretical practice and financial management!
Risk reduction is another critical application. For example, risk-parity portfolios adjust asset allocation based on market volatility. When volatility rises, the portfolio shifts to safer assets like cash; when volatility falls, it reallocates to higher-risk assets for greater returns.
With quantitative data, financial professionals can make more objective and data-backed decisions. If you’re interested in learning more about how quantitative data is used to develop trading strategies, we encourage you to explore this article: Understanding Different Types of Quantitative Strategies
Precise data is the foundation of any successful quantitative strategy. Without reliable data, even the most sophisticated models can produce misleading or inaccurate results, leading to poor investment decisions and costly errors.
As a leading financial and economic data provider, TEJ understands this critical need and offers high-quality to empower rigorous quantitative analysis. Our comprehensive datasets encompass financial performance, risk attributes, and market dynamics, going beyond basic market metrics and stock prices to provide a holistic view.
Additionally, TEJ collaborates with industry leaders like Eagle Alpha, Neudata, and Snowflake, expanding our reach to global investors seeking data-driven success. This ensures seamless access to TEJ’s premium datasets wherever you are.
Take the next step toward smarter, more informed financial decisions and unlock the potential of your investment strategies with TEJ’s quantitative data solutions.
