Table of Contents
In Taiwan stock market, Qualified Foreign Institutional Investors (QFIIs) serve as critical marginal capital for large-cap weight stocks. Taking Taiwan Semiconductor Manufacturing Company (TSMC, 2330.TW) as an example, statistics from the TEJ Broker Trading Database show that from 2023 to May 2026, an average of 57% of TSMC’s daily trading volume originated from foreign institutional brokers. This indicates that the asset allocation direction and trading dynamics of foreign capital exert a significant influence on the pricing of large-cap stocks.
This article focuses on an analytical research of the Foreign-Institutional Trading Concentration (conc_qfii) factor within the TEJ Factor Library. By calculating the ratio of a stock’s daily trading volume from foreign brokers to the total trading volume across all brokers, we measure the extent to which a stock’s trading activity is dominated by foreign institutional main players.
Empirical results indicate that the conc_qfii factor possesses strong predictive power for future expected returns in Taiwan stock market. Under specific size stratification and value-weighted frameworks, its cross-sectional stock-picking performance effectively outperforms the market benchmark (Formosa Return Index, IR0078). This article will systematically examine the theoretical foundation, cross-sectional distribution characteristics, and Information Coefficients (IC) of this factor. By clarifying the critical heterogeneity of foreign institutional chips, we lay a solid theoretical foundation for subsequent quantitative trading strategies.
➡️ Explore the TEJ Factor Library deeper to unlock more quantitative research insights!
The core logic behind the Foreign-Institutional Trading Concentration factor stems from the “information asymmetry” and “informed trading“ hypotheses in financial markets: informed traders leave observable footprints in the cross-sectional distribution of trading volume when trading frequently, and trading volume variance rises as the share of informed trading increases (Lof & Van Bommel, 2023).
In Taiwan stock market, foreign institutions are typical informed traders and hold substantial amounts of capital (commonly referred to as “smart money”). Therefore, the degree of foreign capital dominance in an individual stock’s trading can be viewed as the focus of institutional attention and allocation intensity. Herd behavior (co-directional trading) among institutions accelerates price adjustments (Wermers, 1999), whereas retail investors are typically driven by attention biases to buy stocks, a behavioral bias from which institutional investors are relatively immune (Barber & Odean, 2008). Consequently, focusing on foreign institutional volume rather than the entire market preserves a purer informed signal.
However, this informed signal possesses a critical characteristic in the Taiwan market: Size-conditionality. Due to the inherent trading structure of mega-cap stocks (e.g., TSMC), where foreign institutional brokers naturally account for a structurally higher proportion of volume, the performance of conc_qfii in predicting returns is completely reversed across different market capitalization scales: it exhibits a positive relationship in large-cap stocks but a negative relationship in small-cap stocks. Therefore, the true value of this factor cannot be captured in a broad-market equal-weighted pool; it must be manifested within a framework of size stratification and value weighting.
The trading data and multi-factor indicators used in this study are sourced from the TEJ Database:
The sample period spans from December 2020 to May 2026, and the research subjects cover all common stocks listed on the Taiwan Stock Exchange (TWSE) and the Taipei Exchange (TPEx).
On each trading day, the buy amount and sell amount from foreign brokers for stock i are summed up, divided by the total buy and sell amount of all brokers for that stock on the same day, and multiplied by 100:
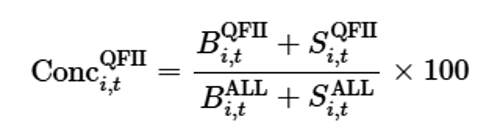
The factor value ranges between 0 and 100. Higher values indicate that the stock’s trading volume is heavily dominated by foreign brokers. Notably, this formula sums both buys and sells, making it a direction-neutral indicator. It measures the participation weight of foreign main players in the stock’s turnover rather than their net buying direction; thus, large-scale liquidations or selling pressure will equally drive up the concentration score.
On each trading day, stocks are sorted by their factor values from smallest to largest and divided into ten equal deciles (P1 lowest to P10 highest). As shown in Table 1, the cross-sectional distribution of the factor is heavily right-skewed. The average concentration of deciles P1 to P9 rises gently from 1.65% to 27.86%, with intra-group standard deviations strictly below 5%.
However, for P10 (the highest decile), the mean abruptly jumps to 43.71%, with a standard deviation of 11.63%, and the maximum value touches 100%.
Cross-sectional checks reveal that the market value weight of P10 is highly concentrated in a few mega-cap dragon stocks (the top three stocks alone account for over 50% of the total market capitalization weight in P10), re-emphasizing the profound importance of size stratification.
Table 1: Descriptive Statistics of conc_qfii Deciles
| Decile | Minimum (Min) | Maximum (Max) | Mean | Standard Deviation (Std) | Observations (Count) | Percentage (%) |
| P1 | 0.00 | 6.83 | 1.65 | 1.10 | 171,176 | 10.03 |
| P2 | 0.36 | 12.38 | 4.79 | 1.64 | 170,622 | 10.00 |
| P3 | 1.08 | 16.29 | 7.89 | 2.03 | 170,537 | 9.99 |
| P4 | 2.00 | 20.05 | 10.72 | 2.30 | 170,628 | 10.00 |
| P5 | 3.19 | 24.07 | 13.34 | 2.54 | 170,750 | 10.00 |
| P6 | 4.74 | 27.76 | 15.95 | 2.81 | 170,406 | 9.98 |
| P7 | 6.69 | 31.12 | 18.82 | 3.11 | 170,531 | 9.99 |
| P8 | 9.17 | 43.43 | 22.37 | 3.54 | 170,637 | 10.00 |
| P9 | 12.57 | 61.03 | 27.86 | 4.53 | 170,521 | 9.99 |
| P10 | 16.63 | 100.00 | 43.71 | 11.63 | 171,062 | 10.02 |
To systematically evaluate the factor’s stock-picking efficacy, we analyze the daily average expected return over a future 21-day holding period. We cross-examine four distinct combinations: “Equal Weight vs. Value Weight” across “All Stocks vs. Large-Cap Stocks”.
The empirical results in Table 2 unveil a critical phenomenon: if an “equal-weighted” scheme is applied, the long-short spread return (P10 – P1) is strictly negative for both all-stocks and large-cap stock universes, forming an inverted U-shaped profile (implying that higher concentration leads to lower returns). However, once we switch to “value weighting”, the long-short spread immediately flips to positive: +0.031% for all stocks and reaching a maximum of +0.040% for the large-cap value-weighted combination.
Table 2: Average Daily Expected Return of conc_qfii Deciles — Four Portfolio Matrix (21D)
| Decile | Equal Weight – All Stocks | Value Weight – All Stocks | Equal Weight – Large Cap | Value Weight – Large Cap |
| P1 | 0.079% | 0.069% | 0.062% | 0.063% |
| P2 | 0.062% | 0.064% | 0.073% | 0.083% |
| P3 | 0.059% | 0.055% | 0.075% | 0.097% |
| P4 | 0.063% | 0.063% | 0.073% | 0.092% |
| P5 | 0.066% | 0.073% | 0.068% | 0.085% |
| P6 | 0.069% | 0.085% | 0.063% | 0.086% |
| P7 | 0.069% | 0.088% | 0.063% | 0.086% |
| P8 | 0.063% | 0.082% | 0.057% | 0.080% |
| P9 | 0.059% | 0.082% | 0.056% | 0.082% |
| P10 (Highest) | 0.055% | 0.100% | 0.056% | 0.104% |
| Long-Short Spread (P10 – P1) | −0.024% | +0.031% | −0.006% | +0.040% |
| Monotonic ρ | −0.42 | +0.79 | −0.72 | +0.21 |
Figure 1: Average Daily Expected Return of conc_qfii Deciles (Value-Weighted · Large-Cap)
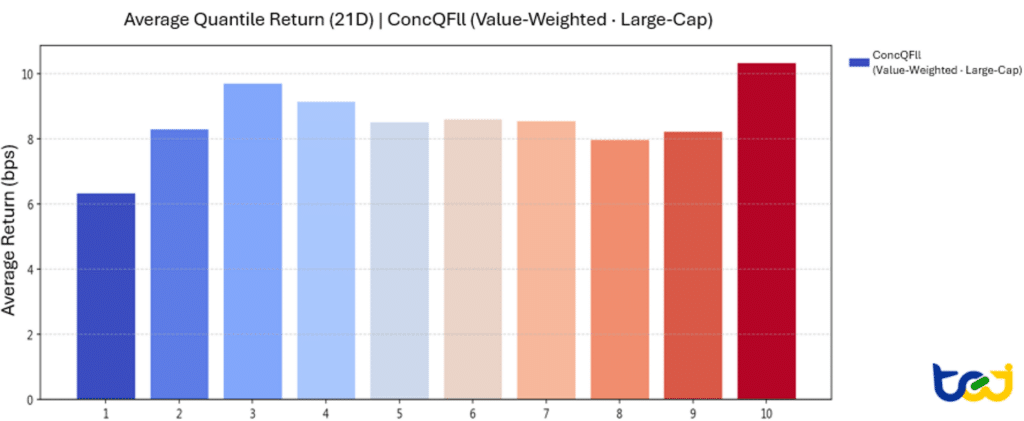
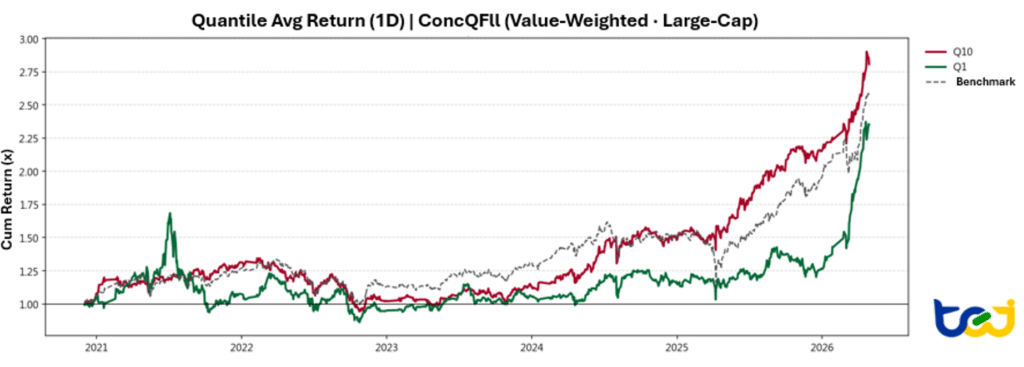
If we expand our view to the cumulative return across the entire sample period, the conclusion remains robust: under the framework of value weighting and large-cap constraints, the highest decile group (P10) demonstrates long-term, stable outperformance over the lowest decile group (P1) as well as the benchmark index.
Figure 2: Cumulative Return of conc_qfii ,Value-Weighted X Large-Cap: Highest Decile (P10), Lowest Decile (P1), and Benchmark Index (IR0078)
To further verify whether the returns of the conc_qfii long-short portfolio are merely compensations for exposure to known systematic risk factors, we run time-series regressions of the long-short portfolios (P10 – P1) against CAPM, the Fama-French three-factor (FF3), and five-factor (FF5) models (applying Newey-West adjusted t-statistics).
Table 3: Risk Factor Regression Alpha Comparison for conc_qfii Long-Short Portfolio (P10−P1)
| Model | Equal Weight – All Stocks | Value Weight – All Stocks | Equal Weight – Large Cap | Value Weight – Large Cap |
| CAPM | −0.978%*** (−5.01) | −0.703%** (−2.12) | −0.732%* (−1.95) | +0.775% (+1.24) |
| FF3 | −0.880%*** (−4.59) | −0.295% (−1.40) | −0.640% (−1.35) | +1.343%** (+2.03) |
| FF5 | −0.935%*** (−5.37) | −0.400% (−1.59) | −1.010%* (−1.94) | +0.886% (+1.40) |
The regression findings (Table 3) mirror the return profiles precisely:
The Information Coefficient (IC) employs Spearman’s Rank Correlation to calculate the sorting consistency between individual stock factor values and future returns. Operating independently of intra-group weights or extreme outliers, it stands as the cleanest tool for diagnosing raw factor direction.
The IC summary in Table 4 shows that all holding periods possess significantly positive mean ICs, with a 21-day win rate touching 60%. Yet, this unearths a classic quantitative paradox: “If the broad-market IC mean is significantly positive, why is the equal-weighted long-short spread return negative?”
The culprit lies in the weight distortions of extreme deciles combined with small-cap noise interference. While Rank IC establishes the cross-sectional reality that “higher concentration dictates a higher subsequent return rank,” the equal-weighted dollar return is heavily skewed and distorted by idiosyncratic small-cap behaviors.
Once the asset universe is narrowed down to the top 30% of large-cap stocks by market capitalization, the 21-day mean IC doubles from 0.0186 to 0.0403, the risk-adjusted IC (Information Ratio) elevates to 0.3864, and the 21-day win rate reaches 64.48%. This serves as definitive proof that the predictive muscle of this factor is highly concentrated within large-cap equities, while its performance in the total market is simply diluted by opposing signals from small-cap stocks.
Table 4: Statistical Summary of conc_qfii Information Coefficients (IC) — All Stocks vs. Large-Cap Stocks
| All Stocks (1D) | Large-Cap ( the top 30% stocks by market capitalization ) | |||||||
| Metric | 1D | 5D | 10D | 21D | 1D | 5D | 10D | 21D |
| IC Mean | 0.0187 | 0.0216 | 0.0201 | 0.0186 | 0.0212 | 0.0312 | 0.0371 | 0.0403 |
| IC Std | 0.0896 | 0.0844 | 0.0779 | 0.0744 | 0.1267 | 0.1124 | 0.1066 | 0.1043 |
| Risk Adjusted IC | 0.2089 | 0.2557 | 0.2577 | 0.2496 | 0.1671 | 0.2773 | 0.3477 | 0.3864 |
| IC > 0 (%) | 57.29 | 59.04 | 60.15 | 60.06 | 55.90 | 60.89 | 63.75 | 64.48 |
| IC > 0.03 (%) | 44.10 | 45.30 | 44.83 | 44.28 | 47.60 | 50.09 | 52.95 | 54.52 |
| IC > 0.05 (%) | 35.06 | 36.72 | 35.52 | 33.76 | 40.31 | 44.10 | 45.48 | 47.32 |
| IC t-value | 6.88 | 8.42 | 8.48 | 8.22 | 5.50 | 9.13 | 11.45 | 12.72 |
| IC p-value | <0.001*** | <0.001*** | <0.001*** | <0.001*** | <0.001*** | <0.001*** | <0.001*** | <0.001*** |
| IC Skewness | 0.1287 | 0.1068 | 0.0239 | 0.0040 | 0.0082 | 0.0658 | −0.0995 | −0.1253 |
| IC Kurtosis | 0.1940 | −0.1189 | 0.0045 | −0.1251 | −0.1741 | −0.0297 | −0.1138 | −0.1442 |
Through a systematic portfolio sorting methodology and rigorous IC diagnostic testing, we have successfully verified that Foreign-Institutional Trading Concentration (conc_qfii) is an exceptional Alpha source for tracking the “smart money” within Taiwan’s large-cap space. However, this factor is not a silver bullet to be blindly followed; its stark “size-conditionality” mapping proves that it functions as a strong positive predictor among large caps but reverses into a negative one among small caps. This emphasizes that only by adopting a dedicated “large-cap focus” combined with a “value-weighted” allocation blueprint can the true profitable power of this factor be entirely unleashed.
Now that we have rigorously established the factor’s stock-picking efficacy in theory and cross-sectional data, the next logical step is to step onto the high-friction battlefield of active execution. In Part 2 (Strategy and Empirical Backtesting), we will unveil the complete process of translating these insights into actionable trading strategies and dissect their performance against the real world!
➡️ Unlock Part 2: Strategy & Backtesting
