
Photo from Pexels
Table of Contents
TEJ (Taiwan Economic Journal) is a renowned financial information service platform in Taiwan. It provides a wide range of data and analysis tools covering various aspects such as economics, finance, stock markets, bond markets, and futures. With its extensive database and professional analytical features, the TEJ platform is widely used by financial institutions, research units, and investors to access real-time, accurate market data and conduct in-depth data analysis to support decision-making.
As financial markets evolve and data analysis demands grow, TEJ offers diverse economic data services, enabling investors to better organize and analyze data in this era of big data, and even to engage in profitable asset trading.
Among TEJ’s many services and products, TEJ API, TEJ Tool API, and TQuant Lab are tools designed for data retrieval and analysis. While they all provide robust data integration tools and analysis capabilities, they differ in specific applications. This article will delve into the main features, usage scenarios, and advantages and disadvantages of these three tools, helping users better understand their distinctions and choose the most suitable one for their needs, ultimately enhancing efficiency in data analysis and investment decision-making.
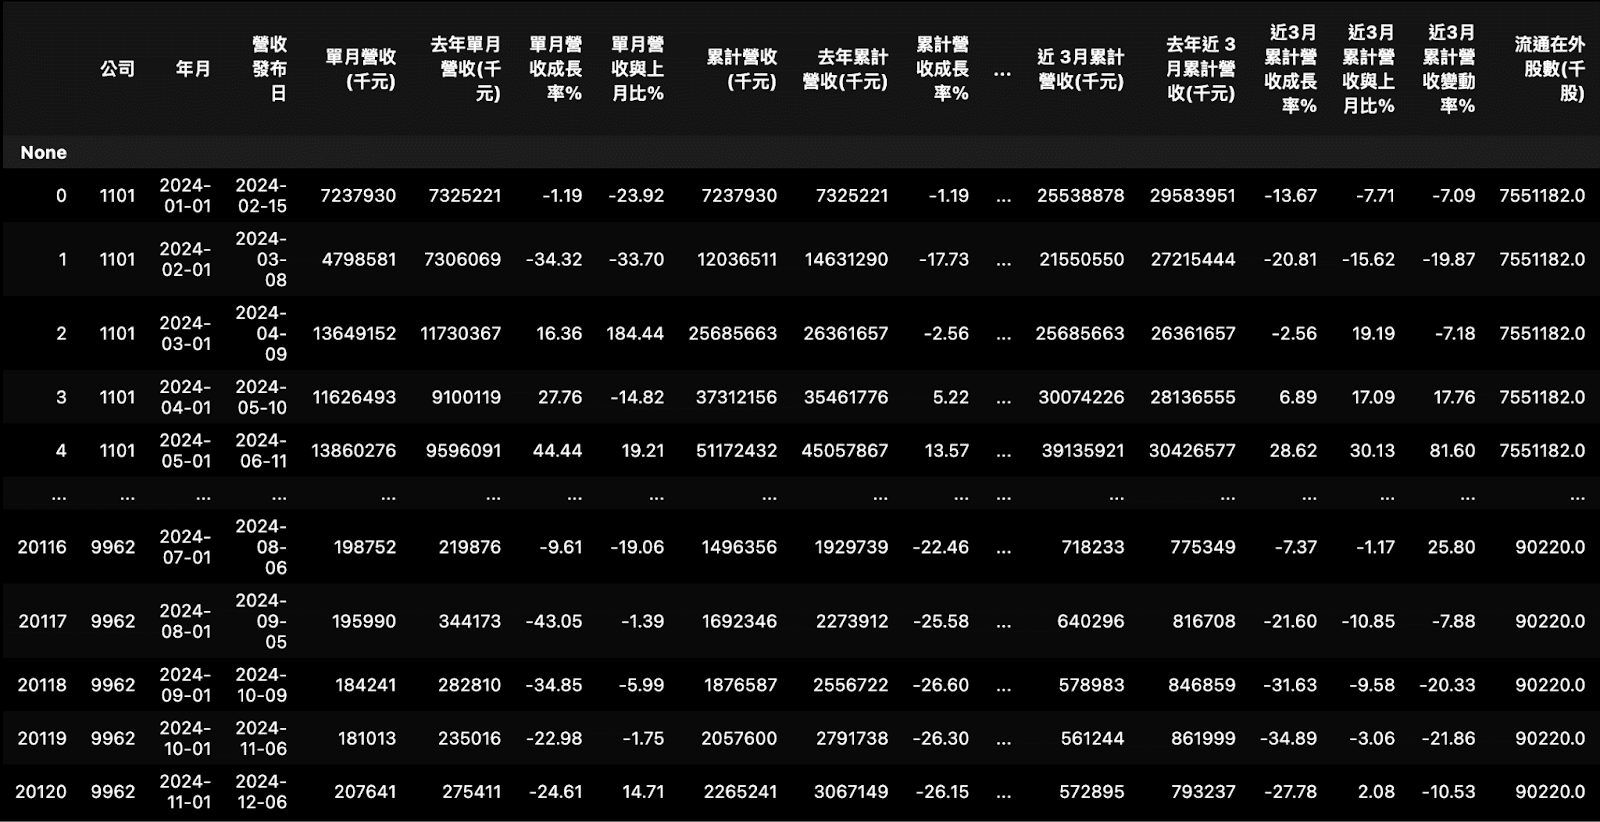
As mentioned above, TEJ focuses on acquiring diverse data from economic markets. From basic stock trading data to detailed accounting items, TEJ API encompasses a wide range of content. Users can retrieve specific stock data by selecting the desired database.
Example:By specifying different databases, users can access various datasets. The following example demonstrates using the monthly revenue database (TWN/APISALE) to retrieve the monthly revenue data of Taiwanese companies for the period from January 1, 2024, to December 31, 2024.
import tejapi
tejapi.ApiConfig.api_key ='your tejapi key'
tejapi.ApiConfig.api_base= "your base"
tejapi.ApiConfig.ignoretz = True


start_date = '2024-01-01'
end_date = '2024-12-31'
data = tejapi.get('TWN/APISALE',     #資料表代碼
                  paginate = True,
                  mdate={'gte': start_date, 'lte': end_date},
                  chinese_column_name = True)
print(data)
For details on the available databases, please refer to the following website: Website
TEJ API primarily provides comprehensive market data, offering single-point data access suitable for basic data analysis, simple data retrieval, and automation needs. It is highly beginner-friendly for those new to working with databases, making it an easy-to-use product for quick deployment.
Building upon an understanding of TEJ API, users can leverage various databases to access diverse data types. However, advanced data users often face the challenge of merging and processing multiple datasets, which requires aligning data by time and frequency. For example, when analyzing both monthly revenue and stock closing prices, users must address the frequency mismatch, as monthly revenue is monthly data while closing prices are daily data.
This is where TEJ Tool API comes into play. It provides services for integrating different types of data, enabling advanced users to skip the manual data consolidation process while ensuring accuracy.
Example:
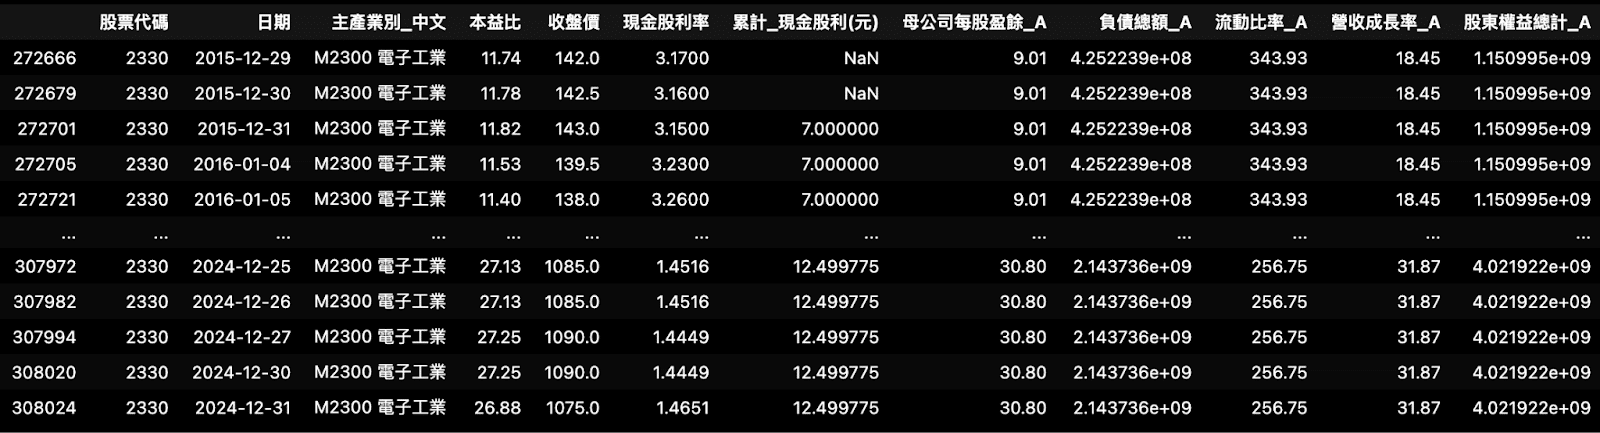
Using the [ get_history_data ] function from TEJ Tool API, users can directly retrieve data for specified fields (as shown in the “columns” section of the illustration). This includes data spanning different frequency types, such as trading data (e.g., closing prices), accounting data (e.g., total liabilities), and financial ratios (e.g., current ratio). These datasets, originally of varying frequencies, can be seamlessly integrated into a single table using TEJ Tool API.
import TejToolAPI


columns = ['Industry', '本益比', '收盤價', '流動比率', '股東權益總計', '負債總額', '營收成長率','eps','mt_div','現金股利率']


start_dt = pd.Timestamp('2015-12-29', tz = 'UTC')
end_dt = pd.Timestamp('2024-12-31', tz = "UTC")


data__ = TejToolAPI.get_history_data(start = start_dt,
                                  end = end_dt,
                                  ticker = pool,
                                  fin_type = 'A', # 為累計資料
                                  columns = columns,
                                  transfer_to_chinese = True)


data__[data__['股票代碼'] == '2330']
For more information about the fields available in TEJ Tool API, please refer to the following website: Website
TEJ Tool API is designed for users requiring diverse data types. By using this API, users can save significant time in data handling. Moreover, in the process of analyzing data, issues such as look-ahead bias and survivorship bias often arise. TEJ Tool API addresses these issues by incorporating the announcement dates for each dataset, ensuring that analytical results remain unbiased, stable, and reliable.
Given the abundance of financial and economic data provided by TEJ, savvy users may consider utilizing this data for quantitative trading analysis. TQuant Lab is a product developed precisely to meet such needs!
TQuant Lab offers professional backtesting tools and factor analysis modules. By integrating market trading information, it allows investors to implement their trading strategies using a simple programming framework. The platform builds upon the Zipline architecture (a well-established backtesting tool internationally), making it more streamlined and user-friendly for beginners in quantitative trading.
To cater to users of varying expertise levels, TQuant Lab provides a wide range of built-in factor analysis tools and indicators, including:
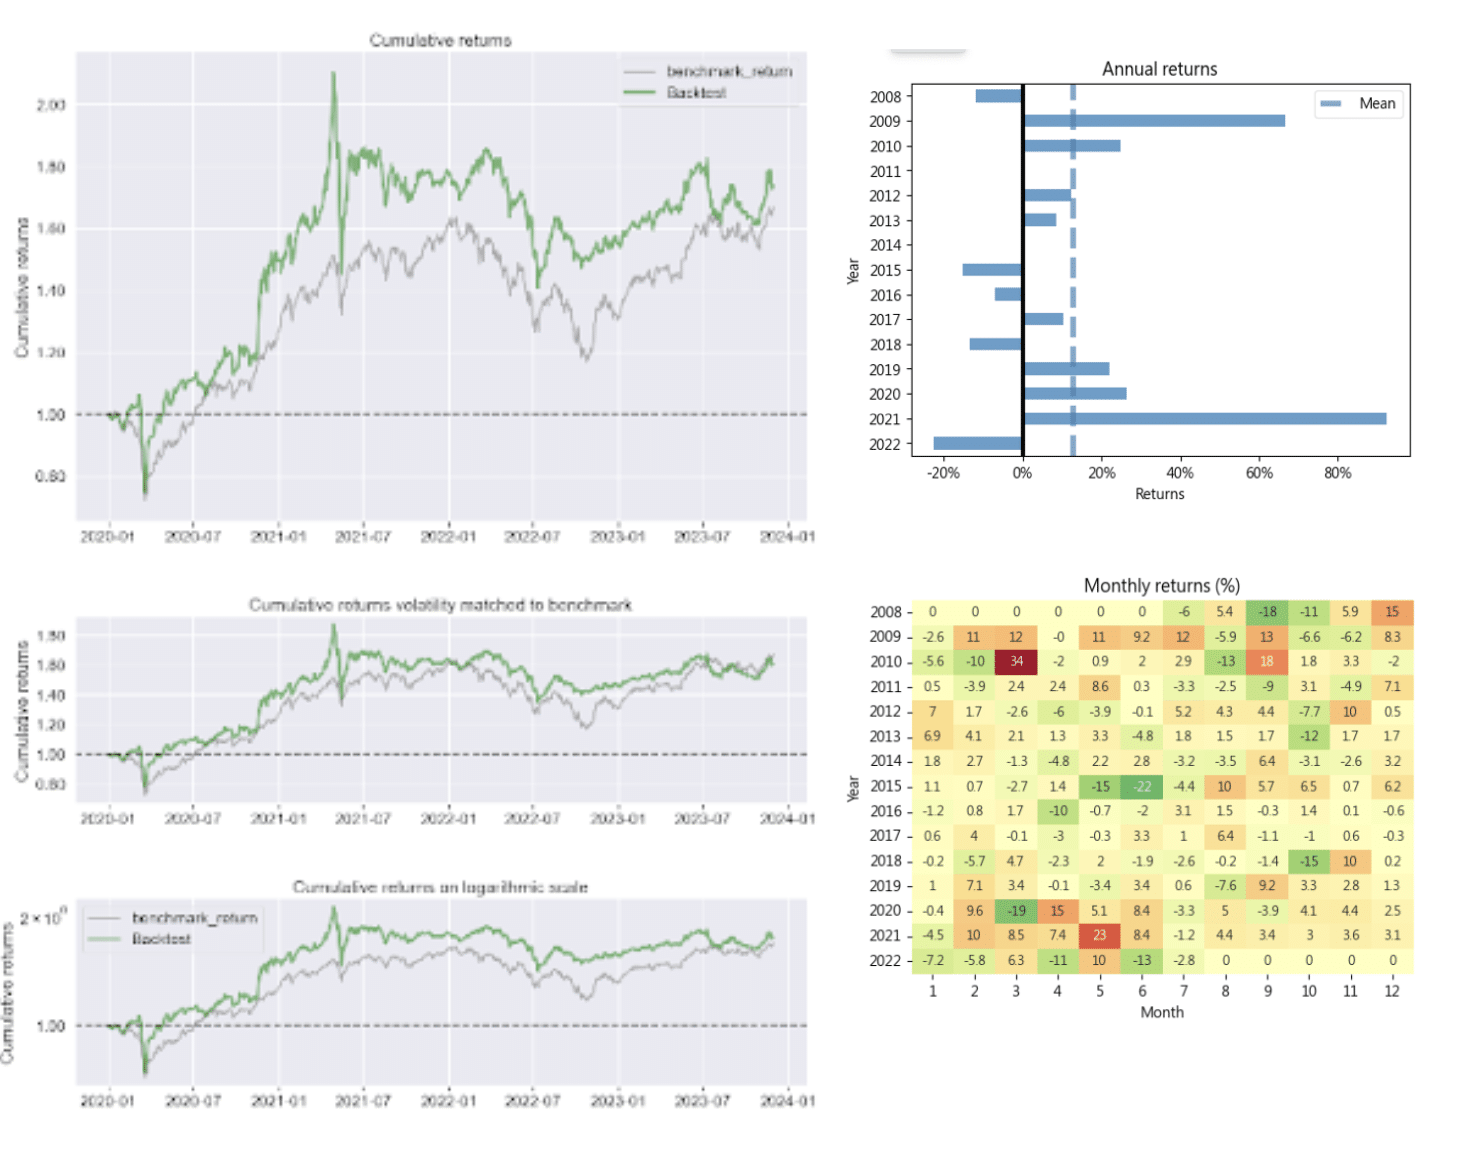
Users can also design and expand custom factors based on their strategy needs, achieving a high degree of customization. Additionally, TQuant Lab features a strategy performance evaluation module, enabling users to analyze portfolio risk and return characteristics, plot cumulative return graphs, leverage utilization charts, and more. Users can even optimize portfolio weights for enhanced efficiency.
With its user-friendly interface and powerful computational capabilities, TQuant Lab is accessible to both seasoned quantitative researchers and newcomers, helping them embark on their journey into quantitative trading.
Important Reminder: This analysis is for reference only and does not constitute any product or investment advice.
We welcome readers interested in various trading strategies to consider purchasing relevant solutions from Quantitative Finance Solution. With our high-quality databases, you can construct a trading strategy that suits your needs.
“Taiwan stock market data, TEJ collect it all.”
The characteristics of the Taiwan stock market differ from those of other European and American markets. Especially in the first quarter of 2024, with the Taiwan Stock Exchange reaching a new high of 20,000 points due to the rise in TSMC’s stock price, global institutional investors are paying more attention to the performance of the Taiwan stock market.
Taiwan Economical Journal (TEJ), a financial database established in Taiwan for over 30 years, serves local financial institutions and academic institutions, and has long-term cooperation with internationally renowned data providers, providing high-quality financial data for five financial markets in Asia.
With TEJ’s assistance, you can access relevant information about major stock markets in Asia, such as securities market, financials data, enterprise operations, board of directors, sustainability data, etc., providing investors with timely and high-quality content. Additionally, TEJ offers advisory services to help solve problems in theoretical practice and financial management!
Illustration of Analysis Charts Supported by TQuant Lab:
(You can add or create visual representations based on the mentioned features, such as cumulative return graphs, leverage charts, or factor analysis plots.)
For instructional articles about TQuant Lab, please refer to : Website
We regularly release related tutorials to guide users in leveraging the platform effectively.
TQuant Lab Tutorial Examples : Website
| Category | TEJ API | TEJ Tool API | TQuant Lab |
| Core Function | Quick data retrieval | Advanced data integration and preprocessing | Comprehensive quantitative trading development |
| Data Source | TEJ database | TEJ database with integrated and cleaned data | TEJ database, multi-tool integration, backtesting capabilities |
| Features | Point-in-Time, complete historical data | Point-in-Time, avoids survivorship bias and look-ahead bias | Backtesting engine, factor analysis, performance evaluation |
| Target Users | Basic data retrieval users | Advanced data processing users | Quantitative investment analysts and backtesting users |
| Pricing | Free access for up to one year of historical data | Not sold separately, included with TQuant Lab | Subscription-based, tailored to data usage requirements |
